The analysis given below on Goldstar's financial state and activity efficiency is made for the period 01.01.2017–31.12.2019 based on the financial statements data prepared according to International Financial Reporting Standards (IFRS).
| Indicator | Value | Change for the period analysed | ||||||
| in thousand EUR | % of the balance total | thousand EUR (col.5-col.2) |
± % ((col.5-col.2) : col.2) |
|||||
| 31.12.2016 | 31.12.2017 | 31.12.2018 | 31.12.2019 | at the beginning of the period analysed (31.12.2016) |
at the end of the period analysed (31.12.2019) |
|||
| 1 | 2 | 3 | 4 | 5 | 6 | 7 | 8 | 9 |
| Assets | ||||||||
| 1. Non-current assets | 187,625,543 | 322,273,637 | 416,299,008 | 503,097,289 | 52 | 76.4 | +315,471,746 | +168.1 |
| 2. Current assets, total | 173,184,851 | 191,660,913 | 207,513,814 | 155,460,157 | 48 | 23.6 | -17,724,694 | -10.2 |
| 4,770,370 | 4,985,680 | 76,222 | 55,162 | 1.3 | <0.1 | -4,715,208 | -98.8 | |
| 128,380,239 | 147,904,069 | 175,094,863 | 89,543,524 | 35.6 | 13.6 | -38,836,715 | -30.3 | |
| 7,132,445 | 2,811,891 | 3,354,882 | 17,435,540 | 2 | 2.6 | +10,303,095 | +144.5 | |
| Equity and Liabilities | ||||||||
| 1. Equity | 236,892,662 | 263,953,835 | 296,713,355 | 328,181,421 | 65.7 | 49.8 | +91,288,759 | +38.5 |
| 2. Non-current liabilities | 24,814,976 | 82,295,647 | 85,046,637 | 26,441,244 | 6.9 | 4 | +1,626,268 | +6.6 |
| 3. Current liabilities | 99,102,756 | 167,685,068 | 242,052,830 | 303,934,781 | 27.5 | 46.2 | +204,832,025 | +3.1 times |
| Assets; Equity and Liabilities | 360,810,394 | 513,934,550 | 623,812,822 | 658,557,446 | 100 | 100 | +297,747,052 | +82.5 |
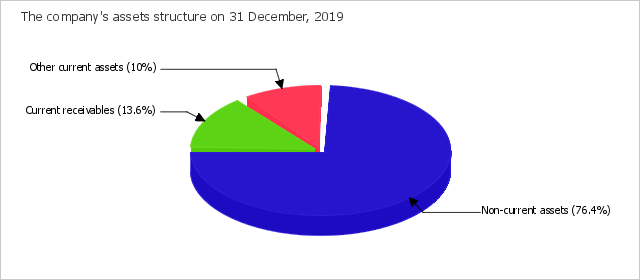
According to the data given in the table, the share of Goldstar's current assets equaled about a quarter (23.6%) on the last day of the period analysed, while non-current assets equaled three quarters of the all assets. It was seen that there was a significant increase in the assets of EUR 297,747,052 thousand, or of 83% (to EUR 658,557,446 thousand) for the entire period reviewed. Assets and equity were observed to grow simultaneously by 38.5% during the last 3 years. Growth of the equity value is a factor which positively describes the dynamics of Goldstar's financial state.
The increase in total assets of Goldstar occurred due to the growth of the item "Other non-current financial assets" by EUR 331,695,629 thousand, that was 92.8% of all positively changed asset types.
The most significant growth of sources of finance ("Equity and Liabilities") is seen on the following rates (the percentage from total equity and liabilities change is shown in brackets):
The most significantly changed items on the balance sheet during the entire period reviewed are "Trade and other current receivables" in assets and "Trade and other current payables" in sources of finance (EUR -38,836,715 thousand and EUR -31,194,485 thousand, respectively).
Correlation of basic asset groups is demonstrated in the chart below.
On the last day of the period analysed, the inventories were equal to EUR 55,162 thousand. For the whole period reviewed, the inventories went down by EUR 4,715,208 thousand.
For the whole period analysed, it was seen that there was a marked lowering in the current receivables of EUR 38,836,715 thousand, or of 30.3%.
| Indicator | Value | Change | ||||||
| in thousand EUR | % of the balance total | thousand EUR (col.3-col.2), |
%, ((col.3 -col.2) : col.2) | |||||
| at the beginning of the period analysed (31.12.2016) | at the end of the period analysed (31.12.2019) | 31.12.2016 | 31.12.2017 | 31.12.2018 | 31.12.2019 | |||
| 1 | 2 | 3 | 4 | 5 | 6 | 7 | 8 | 9 |
| 1. Net tangible assets | 236,857,787 | 328,071,056 | 65.6 | 51.3 | 47.6 | 49.8 | +91,213,269 | +38.5 |
| 2. Net assets (Net worth) | 236,892,662 | 328,181,421 | 65.7 | 51.4 | 47.6 | 49.8 | +91,288,759 | +38.5 |
| 3. Issued (share) capital | 21,264 | 21,264 | <0.1 | <0.1 | <0.1 | <0.1 | – | – |
| 4. Difference between net assets and Issued (share) capital (line 2 - line 3) | 236,871,398 | 328,160,157 | 65.6 | 51.4 | 47.6 | 49.8 | +91,288,759 | +38.5 |
On the last day of the period analysed (31.12.2019), the net tangible assets were EUR 328,071,056 thousand. During the whole period analysed, it was found that there was an obvious growth in the net tangible assets of EUR 91,213,269 thousand, or of 38.5%. The intangible assets equaled EUR 110,365 thousand at the end of the period reviewed. This value shows the difference between the value of net tangible assets and all net worth.
On the last day of the period analysed (31.12.2019), the net worth of Goldstar was much higher (by 15,433.7 times) than the share capital. Such a ratio positively describes the company's financial position. The net worth (net assets) value is used as one of the tools to estimate the company's value (used together with other methods, such as discounted cash flow method, or an estimation based on shareholder's value etc.). But it is a key value in the estimation of the company's financial condition.
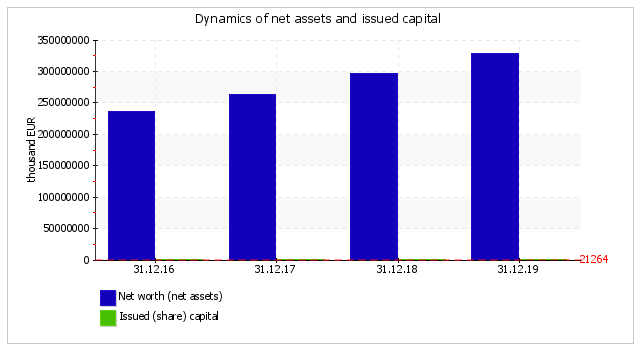
The issued (share) capital did not alter during the whole of the analysed period.
| Ratio | Value | Change (col.5-col.2) |
Description of the ratio and its recommended value | |||
| 31.12.2016 | 31.12.2017 | 31.12.2018 | 31.12.2019 | |||
| 1 | 2 | 3 | 4 | 5 | 6 | 7 |
| Debt-to-equity ratio (financial leverage) | 0.52 | 0.95 | 1.1 | 1.01 | +0.49 | A debt-to-equity ratio is calculated by taking the total liabilities and dividing it by shareholders' equity. It is a key financial ratio and is used as a standard for judging a company's financial standing. Normal value: no more than 1.5 (optimum 0.43-1). |
| Debt ratio (debt to assets ratio) | 0.34 | 0.49 | 0.52 | 0.5 | +0.16 | A debt ratio is calculated by dividing total liabilities (i.e. long-term and short-term liabilities) by total assets. It shows how much the company relies on debt to finance assets (similar to debt-to-equity ratio). Normal value: 0.6 or less (optimum 0.3-0.5). |
| Long-term debt to Equity | 0.1 | 0.31 | 0.29 | 0.08 | -0.02 | This ratio is calculated by dividing long-term (non-current) liabilities by equity. |
| Non-current assets to Net worth | 0.79 | 1.22 | 1.4 | 1.53 | +0.74 | This ratio is calculated by dividing long-term (non-current) assets by net worth (equity) and measures the extent of a company's investment in low-liquidity non-current assets. This ratio is important for comparison analysis because it's less dependent on industry (structure of company's assets) than debt ratio and debt-to-equity ratio. Normal value: no more than 1.25. |
| Capitalization ratio | 0.09 | 0.24 | 0.22 | 0.07 | -0.02 | Calculated by dividing non-current liabilities by the sum of equity and non-current liabilities. |
| Fixed assets to Net worth | 0.03 | 0.02 | 0.02 | 0.01 | -0.02 | This ratio indicates the extent to which the owners' cash is frozen in the form of fixed assets, such as property, plant, and equipment, investment property and non-current biological assets. Normal value: no more than 0.75. |
| Current liability ratio | 0.8 | 0.67 | 0.74 | 0.92 | +0.12 | Current liability ratio is calculated by dividing current liabilities by total (i.e. current and non-current) liabilities. |
First, attention should be drawn to the debt-to-equity ratio and debt ratio as the ratios describing the capital structure. Both ratios have similar meaning and indicate if there is not enough capital (equity) for stable work for the company. Debt-to-equity ratio is calculated as a relationship of the borrowed capital (liabilities) to the equity, while debt ratio is calculated as a relationship of the liabilities to the overall capital (i.e. the sum of equity and liabilities).
On 31.12.2019, the debt-to-equity equaled 1.01. On the last day of the period analysed, the debt ratio amounted to 0.5. The debt ratio significantly increased (by 0.16) for the last 3 years.
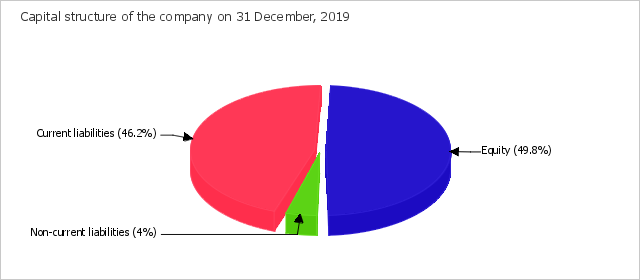
The debt ratio describes Goldstar's financial condition as a good one on the last day of the period analysed, the percentage of liabilities is 50.2%, while a maximum acceptable percentage is deemed to be 60%. During the whole of the reviewed period, the debt ratio kept a normal value.
The structure of the company's capital is shown in the chart below:
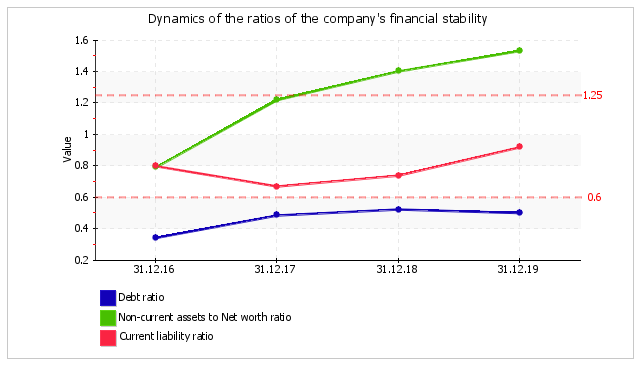
According to well known principles for stable company development, investments with the least liquid assets (non-current assets) should first be made with help from the most long-term sources of financing, i.e. with the help of own capital (equity). An indicator of this rule is the non-current assets to net worth ratio. On 31.12.2019, the ratio was equal to 1.53. For the whole period analysed, the ratio was found to spring up rapidly by 0.74. At the end of the period reviewed, the value of the ratio is not a normal one.
The current liability ratio is 0.92 on 31.12.2019. It means that the overall shares of current and non-current liabilities of a company's liabilities are 92% and 8%, respectively. An unbalance of financial sources to the side of liabilities with short maturity can negatively influence financial stability and the company's solvency. This is why it is important to be careful with an increase in short-term liabilities.
The change in the main ratios of financial stability of Goldstar is demonstrated for the whole period analysed in the chart below.
| Indicator | Value | Change for the period analysed | ||||
| 31.12.2016 | 31.12.2017 | 31.12.2018 | 31.12.2019 | (col.5-col.2) | % ((col.5-col.2) : col.2) |
|
| 1 | 2 | 3 | 4 | 5 | 6 | 7 |
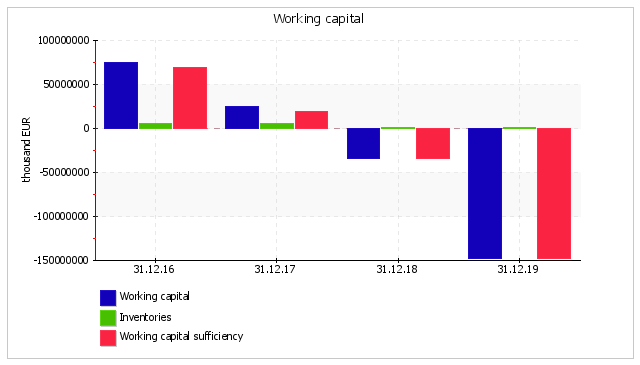
| 1. Working capital (net working capital), thousand EUR | +74,082,095 | +23,975,845 | -34,539,016 | -148,474,624 | -222,556,719 | ↓ |
| 2. Inventories, thousand EUR | +4,770,370 | +4,985,680 | +76,222 | +55,162 | -4,715,208 | -98.8 |
| 3. Working capital sufficiency (1-2), thousand EUR | +69,311,725 | +18,990,165 | -34,615,238 | -148,529,786 | -217,841,511 | ↓ |
| 4. Inventory to working capital ratio (2:1) Normal value: no more than 1. | 0.06 | 0.21 | -<0.01 | -<0.01 | -0.06 | x |
Goldstar's working capital has a negative value (EUR -148,474,624 thousand) on 31 December, 2019. This means that current liabilities exceed current assets. In such a situation it makes no sense to compare working capital with inventories of the company. Under normal conditions, the inventory to working capital ratio should not be less than 1.
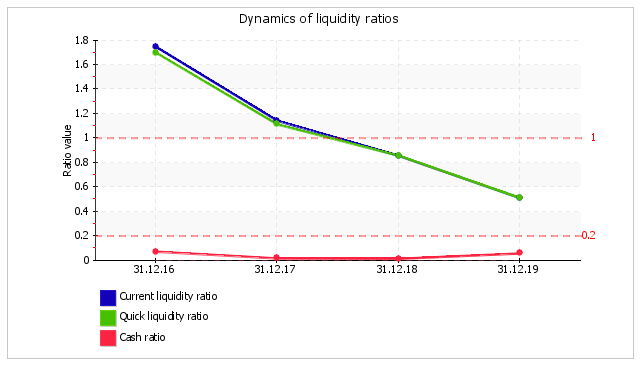
One of the most widespread indicators of a company's solvency are liquidity related ratios. The current ratio shows the capacity of a company to meet current liabilities with all available current assets. Quick ratio describes solvency in the near future. Cash ratio shows if there is enough means for uninterrupted execution of current transactions. Current ratio, quick ratio and cash ratio for Goldstar are calculated in the following table.
| Liquidity ratio | Value | Change (col.5 - col.2) |
Description of the ratio and its recommended value | |||
| 31.12.2016 | 31.12.2017 | 31.12.2018 | 31.12.2019 | |||
| 1 | 2 | 3 | 4 | 5 | 6 | 7 |
| 1. Current ratio (working capital ratio) | 1.75 | 1.14 | 0.86 | 0.51 | -1.24 | The current ratio is calculated by dividing current assets by current liabilities. It indicates a company's ability to meet short-term debt obligations. Normal value: 2 or more. |
| 2. Quick ratio (acid-test ratio) | 1.7 | 1.11 | 0.86 | 0.51 | -1.19 | The quick ratio is calculated by dividing liquid assets (cash and cash equivalents, trade and other current receivables, other current financial assets) by current liabilities. It is a measure of a company's ability to meet its short-term obligations using its most liquid assets (near cash or quick assets). Normal value: 1 or more. |
| 3. Cash ratio | 0.07 | 0.02 | 0.01 | 0.06 | -0.01 | Cash ratio is calculated by dividing absolute liquid assets (cash and cash equivalents) by current liabilities.
Acceptable value: no less than 0.2. |
During the period analysed (31.12.16–31.12.19), the current ratio sharply dropped by 1.24 and equaled 0.51. On 31 December, 2019, the value of the ratio is unacceptable and lies in the area of critical values. During the whole of the analysed period, the current ratio kept a value outside the acceptable range.
The quick ratio was equal to 0.51 at the end of the period reviewed. The quick ratio sharply decreased (by 1.19) for the whole period analysed. The ratio was continuously falling during the whole of the evaluated period. On the last day of the period analysed (31.12.2019), the quick ratio shows an unsatisfactory value. It means that Goldstar does not have enough liquid assets (cash and other assets which can be rapidly sold) to meet all their current liabilities.
The value of the third ratio, the cash ratio, similar to the two previous ratios, does not lie in the acceptable range on 31.12.2019. Goldstar is observed to have a deficit of cash and cash equivalents to meet current liabilities.
The table below tells us about the main financial results of Goldstar's activities during the 3 years.
| Indicator | Value, thousand EUR | Change | Average annual value, thousand EUR |
|||
| 2017 | 2018 | 2019 | thousand EUR (col.4 - col.2) |
± % (4-2) : 2 |
||
| 1 | 2 | 3 | 4 | 5 | 6 | 7 |
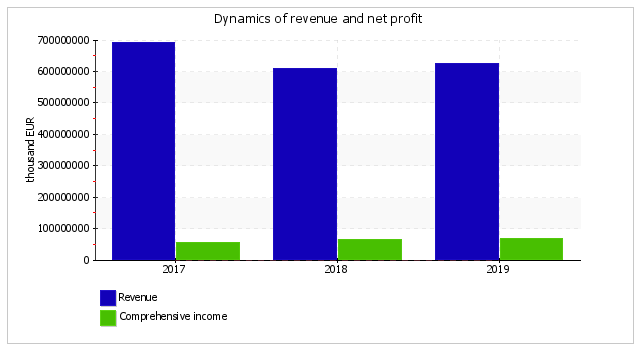
| 1. Revenue | 693,032,679 | 609,821,837 | 623,979,575 | -69,053,104 | -10 | 642,278,030 |
| 2. Cost of sales | 566,143,059 | 489,837,720 | 512,028,603 | -54,114,456 | -9.6 | 522,669,794 |
| 3.Gross profit (1-2) | 126,889,620 | 119,984,117 | 111,950,972 | -14,938,648 | -11.8 | 119,608,236 |
| 4. Other income and expenses, except Finance costs | -52,797,606 | -26,430,917 | -19,887,930 | +32,909,676 | ↑ | -33,038,818 |
| 5. EBIT (3+4) | 74,092,014 | 93,553,200 | 92,063,042 | +17,971,028 | +24.3 | 86,569,419 |
| 5a. EBITDA | 75,352,580 | 95,704,561 | 94,505,386 | +19,152,806 | +25.4 | 88,520,842 |
| 6. Finance costs | 2,378,700 | 6,308,164 | 4,520,565 | +2,141,865 | +90 | 4,402,476 |
| 7. Income tax expense (from continuing operations) | 16,583,554 | 22,117,859 | 20,350,754 | +3,767,200 | +22.7 | 19,684,056 |
| 8. Profit (loss) from continuing operations (5-6-7) | 55,129,760 | 65,127,177 | 67,191,723 | +12,061,963 | +21.9 | 62,482,887 |
| 9. Profit (loss) from discontinued operations | – | – | – | – | – | – |
| 10. Profit (loss) (8+9) | 55,129,760 | 65,127,177 | 67,191,723 | +12,061,963 | +21.9 | 62,482,887 |
| 11. Other comprehensive income | – | – | – | – | – | – |
| 12. Comprehensive income (10+11) |
55,129,760 | 65,127,177 | 67,191,723 | +12,061,963 | +21.9 | 62,482,887 |
During the year 2019, the revenue was EUR 623,979,575 thousand. For the 3 years, it was found that there was an appreciable decrease in the revenue, which showed EUR 69,053,104 thousand. The change in revenue is demonstrated on the chart. During the last year, the gross profit was equal to EUR 111,950,972 thousand. For the period analysed (from 31.12.2016 to 31.12.2019), the gross profit dropped noticeably (EUR -14,938,648 thousand).
During the year 2019, the company posted a gross profit and earnings before interest and taxes (EBIT), which was EUR 92,063,042 thousand. The total comprehensive income was EUR 67,191,723 thousand for the year 2019.
| Profitability ratios | Value in % | Change (col.4 - col.2) |
||
| 2017 | 2018 | 2019 | ||
| 1 | 2 | 3 | 4 | 5 |
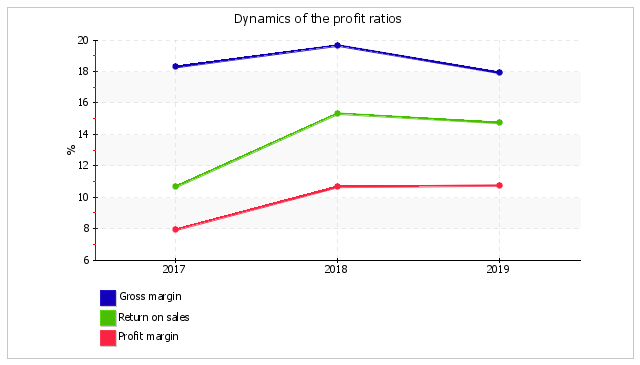
| 1. Gross margin. | 18.3 | 19.7 | 17.9 | -0.4 |
| 2. Return on sales (operating margin). | 10.7 | 15.3 | 14.8 | +4.1 |
| 3. Profit margin. | 8 | 10.7 | 10.8 | +2.8 |
| Reference: Interest coverage ratio (ICR). Normal value: 1.5 or more. |
31.1 | 14.8 | 20.4 | -10.8 |
For the last year, the company gained gross profit and profit from operational and financial activities, which became a reason for positive values of all three profitability ratios given in the table for this period. During the period from 01.01.2019 to 31.12.2019, the gross margin equaled 17.9%. For the last year in comparison with the same period of the prior financial year, the gross margin moderately went down (-0.4%).
Profitability calculated using EBIT (return on sales) deserves more attention. For the year 2019, the return on sales was 0.15 (or 14.8% per annum), and profitability calculated by net profit was 10.8% per annum.
To assess the liabilities that the company should repay for the use of borrowed capital, an interest coverage ratio was calculated. The acceptable value is deemed to be not less than 1.5. In this case, the interest coverage ratio was 20.4 for the year 2019, which is evidence of Goldstar's capability to pay interest on borrowed assets. It should also be mentioned that not all interest payments are necessarily included on the income statement and used to calculate the indicated ratio. Interest related to investments in qualified assets is not included in the financial results (they are taken into account in the asset value).
| Profitability ratios | Value, % | Change (col.4 - col.2) |
Description of the ratio and its reference value | ||
| 2017 | 2018 | 2019 | |||
| 1 | 2 | 3 | 4 | 5 | 6 |
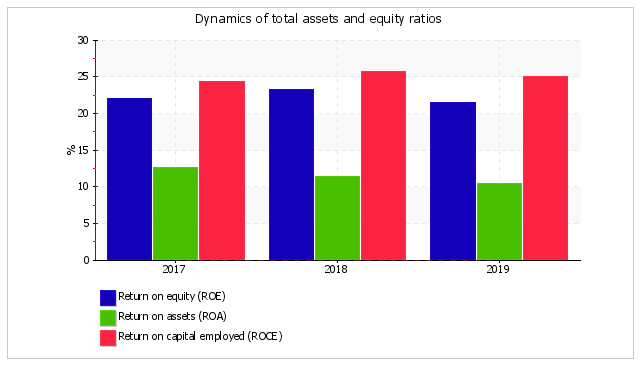
| Return on equity (ROE) | 22 | 23.2 | 21.5 | -0.5 | ROE is calculated by taking a year's worth of earnings (net profit) and dividing them by the average shareholder equity for that period, and is expressed as a percentage. It is one of the most important financial ratios and profitability metrics. Normal value: 12% or more. |
| Return on assets (ROA) | 12.6 | 11.4 | 10.5 | -2.1 | ROA is calculated by dividing net income by total assets, and displayed as a percentage. Normal value: no less than 6%. |
| Return on capital employed (ROCE) | 24.4 | 25.7 | 25 | +0.6 | ROCE is calculated by dividing EBIT by capital employed (equity plus non-current liabilities). It indicates the efficiency and profitability of a company's capital investments. |
During the period 01.01–31.12.2019, the return on assets was equal to 10.5%. The return on assets reduced by 2.1% for the entire period reviewed. The return on assets kept a normal value during the whole of the analysed period.
One of the most important ratio of business profitability is the return on equity (ROE), which reflects the profitability of investments by the owners. The profitability of the owners' investments in Goldstar's assets was 21.5% per annum for the last year. It is a high rate, but it is influenced not only with factors inside the company, but also the economic environment where the company is located (inflation rate, interest rates, etc).
The following chart demonstrates the dynamics of the main rates of return on total assets and equity of Goldstar during the period analysed (from 31.12.2016 to 31.12.2019).
To assess Goldstar's business activity, the table below provides the main rates of turnover: receivables, inventory, current and total assets turnovers; accounts payable and capital turnovers of the company. Turnover ratios have strong industry specifics and depend on activity. This is why an absolute value of the ratios does not permit making a qualitative assessment. When assets turnover ratios are analysed, an increase in ratios (i.e. velocity of circulation) and a reduction in circulation days are deemed to be positive dynamics. There is no well-defined interaction for accounts payable and capital turnover. In any case, an accurate conclusion can only be made after the reasons that caused these changes are considered.
| Turnover ratio | Value, days | Ratio 2017 |
Ratio 2019 |
Change, days (col.4 - col.2) |
||
| 2017 | 2018 | 2019 | ||||
| 1 | 2 | 3 | 4 | 5 | 6 | 7 |
| Receivables turnover (days sales outstanding) (average trade and other current receivables divided by average daily revenue*) |
73 | 97 | 77 | 5 | 4.7 | +4 |
| Accounts payable turnover (days payable outstanding) (average current payables divided by average daily purchases) |
43 | 61 | 49 | 8.4 | 7.5 | +6 |
| Inventory turnover (days inventory outstanding) (average inventory divided by average daily cost of sales) |
3 | 2 | <1 | 116.1 | 7,794.4 | -3 |
| Asset turnover (average total assets divided by average daily revenue) |
230 | 340 | 375 | 1.6 | 1 | +145 |
| Current asset turnover (average current assets divided by average daily revenue) |
96 | 119 | 106 | 3.8 | 3.4 | +10 |
| Capital turnover (average equity divided by average daily revenue) |
132 | 168 | 183 | 2.8 | 2 | +51 |
| Reference: Cash conversion cycle (days sales outstanding + days inventory outstanding - days payable outstanding) |
33 | 38 | 29 | x | x | -4 |
According to the above table, the average collection period (Days Sales Outstanding), calculated based on the data for the period 01.01–31.12.2019, was 77 days, while average repayment period for credit debts (Days Payable Outstanding) was 49 days. The rate of asset turnover means that Goldstar gains revenue equal to the sum of all the available assets every 315 days (on average during the last 3 years).
The most important indicators of Goldstar's financial state and activity results are summarized below by using a qualitative assessment during the period reviewed (from 31.12.2016 to 31.12.2019).
The following of Goldstar's financial characteristics show extremely good values:
The analysis revealed the following good financial indicators:
The following indicator is the financial characteristic with the value which borders on the edge of standard – the increase in equity during the period analysed was lower than the growth rates of total assets.
The following are the unsatisfactory financial indicators:
The following characteristics describe the financial state as critical critical:
|
|
||||||||||||||||||||||||||||||||||||||||||||||||||||||||||||||||||||||||||||||||||||||||||||||||||||||||||||||||||||||||||||||||||||
The following conclusions were made based on a qualitative assessment of the rates at the end of the period analysed, their dynamics during the period and the forecast for the next year. Scores of the financial position and activity results for Goldstar were -0.34 and +1.36, respectively, i.e. the financial position is characterized as satisfactory; the financial results are described as very good during the entire period reviewed. These two scores were used to calculate the final rating score of the company's financial condition, which made BB (normal condition).
"BB" describes the financial condition of a company when the majority of ratios are normal. Companies with this rating should be considered as business partners who will need to be treated carefully when managing risks. These companies can lay a claim to obtain credit but a decision mainly depends on the analysis of additional factors (neutral creditworthiness).
The Altman Z-score calculated below as one of the rates of probable bankruptcy of the company (a 5-factor model for private manufacturing firms is taken for Goldstar):
Z-score = 0.717T1 + 0.847T2 + 3.107T3 + 0.42T4 + 0.998T5 , where
| Ratio | Calculation | Ratio value on 31.12.2019 | Weighting factor | Product (col. 3 x col. 4) |
| 1 | 2 | 3 | 4 | 5 |
| T1 | Working Capital / Total Assets | -0.23 | 0.717 | -0.16 |
| T2 | Retained Earnings / Total Assets | +0.48 | 0.847 | +0.41 |
| T3 | Earnings Before Interest and Taxes / Total Assets | +0.14 | 3.107 | +0.43 |
| T4 | Equity / Total Liabilities | +0.99 | 0.42 | +0.42 |
| T5 | Sales / Total Assets | +0.95 | 0.998 | +0.95 |
| Altman Z-score: | +2.04 | |||
Discrimination ranges:
According to calculations, on the last day of the period analysed (31.12.2019), the Z-score equaled 2.04 for Goldstar. Such a value says about probability that Goldstar will go into bankruptcy (the value is in the border zone). Despite the results obtained, it should be mentioned that the Altman Z-score as a predictor of the company's bankruptcy probability is only relative, and the final conclusion should be made based on results of an even deeper analysis.
Another bankruptcy forecast algorithm is Taffler Model, which has the following formula:
Z = 0,53X1 + 0,13X2 + 0,18X3 + 0,16X4 , where
| Ratio | Calculation | Ratio value on 31.12.2019 | Weighting factor | Product (col. 3 х col. 4) |
| 1 | 2 | 3 | 4 | 5 |
| X1 | Gross profit / Current liabilities | 0.37 | 0,53 | 0.2 |
| X2 | Current assets / Total liabilities | 0.47 | 0,13 | 0.06 |
| X3 | Current liabilities / Total assets | 0.46 | 0,18 | 0.08 |
| X4 | Revenue from sales / Total assets | 0.95 | 0,16 | 0.15 |
| Taffler Z-score: | 0.49 | |||
Function values are interpreted as follows:
Final score according to Taffler Model is 0.49. So there is a low probability of bankruptcy risk.
| Ratio | Weighting factor | Score | Average score (col.3 x 0.25 + col.4 x 0.6 + col.5 x 0.15) |
Weighted average score (col.2 x col.6) |
||
| past | present | future | ||||
| 1 | 2 | 3 | 4 | 5 | 6 | 7 |
| I. Rating of the company's financial position | ||||||
| Debt ratio | 0.3 | +2 | +1 | +1 | +1.25 | +0.375 |
| Non-current assets to net worth | 0.15 | +1 | -1 | -1 | -0.5 | -0.075 |
| Current ratio | 0.2 | -1 | -2 | -2 | -1.75 | -0.35 |
| Quick ratio | 0.2 | +2 | -1 | -2 | -0.4 | -0.08 |
| Cash ratio | 0.15 | -2 | -1 | -2 | -1.4 | -0.21 |
| Total | 1 | Final score (in total col.7 : col. 2): | -0.34 | |||
| II. Rating of the company's financial performance | ||||||
| Return on equity (ROE) | 0.5 | +2 | +2 | +2 | +2 | +1 |
| Return on assets (ROA) | 0.3 | +2 | +2 | +1 | +1.85 | +0.555 |
| Sales growth | 0.2 | -1 | -1 | -1 | -1 | -0.2 |
| Total | 1 | Final score (in total col.7 : col. 2): | +1.355 | |||
Final rating score for Goldstar's financial condition: (-0.34 x 0,6) + (+1.355 x 0,4) = +0.34 (BB - normal)
Reference: Financial condition scale
| Total score | Sign | The qualitative assessment of a financial condition | |
| from |
to (inclusive) |
||
| 2 | 1.6 | AAA | Excellent |
| 1.6 | 1.2 | AA | Very good |
| 1.2 | 0.8 | A | Good |
| 0.8 | 0.4 | BBB | Positive |
| 0.4 | 0 | BB | Normal |
| 0 | -0.4 | B | Satisfactory |
| -0.4 | -0.8 | CCC | Unsatisfactory |
| -0.8 | -1.2 | CC | Adverse |
| -1.2 | -1.6 | C | Bad |
| -1.6 | -2 | D | Critical |