The analysis represented in this report on Foodmaster's financial state and activity efficiency is made for the period from 01/01/2019 to 12/31/2019 based on the financial statements data prepared in accordance with standards generally accepted in the United States of America (US GAAP).
| Indicator | Value | Change for the period analyzed | ||||
| in thousand USD | % of the balance total | thousand USD (col.3-col.2) |
± % ((col.3-col.2) : col.2) |
|||
| 12/31/2018 | 12/31/2019 | at the beginning of the period analyzed (12/31/2018) |
at the end of the period analyzed (12/31/2019) |
|||
| 1 | 2 | 3 | 4 | 5 | 6 | 7 |
| Assets | ||||||
| 1. Current assets, total | 299 | 475 | 25.7 | 34.4 | +176 | +58.9 |
| 2 | 43 | 0.2 | 3.1 | +41 | +21.5 times | |
| 12 | 34 | 1 | 2.5 | +22 | +183.3 | |
| 233 | 342 | 20.1 | 24.8 | +109 | +46.8 | |
| 2. Noncurrent assets | 863 | 905 | 74.3 | 65.6 | +42 | +4.9 |
| Liabilities and Equity | ||||||
| 1. Current liabilities | 397 | 320 | 34.2 | 23.2 | -77 | -19.4 |
| 2. Noncurrent liabilities | 526 | 560 | 45.3 | 40.6 | +34 | +6.5 |
| 3. Stockholders' equity | 239 | 500 | 20.6 | 36.2 | +261 | +109.2 |
| Assets; Liabilities and Equity | 1,162 | 1,380 | 100 | 100 | +218 | +18.8 |
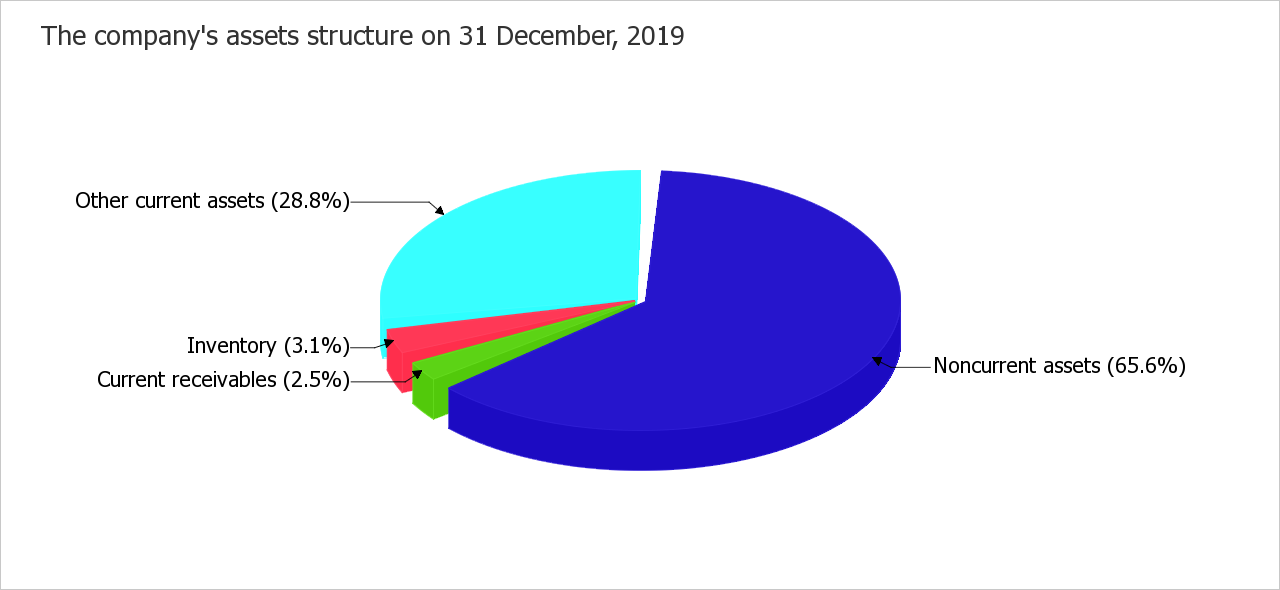
According to the table above, noncurrent assets were about two thirds of Foodmaster's assets (65.6%) on the last day of the period analyzed (12/31/2019), while current assets took one third. For the entire period analyzed, the assets appreciably went up to USD 1,380 thousand (by USD 218 thousand, or by 18.8%). At the same time, equity has grown even more (+109.2% during the period reviewed (2019)). An outrunning growth of equity is a factor with positive influence on the financial stability of Foodmaster.
The total growth of Foodmaster's assets value is mainly connected with the growth value of the following assets (amount of change and percentage of this change relative to the total assets growth are shown below):
The most significant growth of sources of finance ("Equity and Liabilities") is seen on the following rates (the percentage from total equity and liabilities change is shown in brackets):
Total assets of the company did not grow to a greater degree due to a negative change in items such as "Prepaid expense" in assets and "Other current liabilities" in the company's sources of finance, which were USD -1 thousand and USD -42 thousand respectively for the period analyzed (2019).
The inventory were equal to USD 43 thousand on 31 December, 2019. For the period analyzed (2019), it was found that there was a significant growth in the inventory of 22 times.
The current receivables went up by 183.3% for the year.
| Indicator | Value | Change | ||||
| in thousand USD | % of the balance total | thousand USD (col.3-col.2), |
%, ((col.3 -col.2) : col.2) | |||
| at the beginning of the period analyzed (12/31/2018) | at the end of the period analyzed (12/31/2019) | 12/31/2018 | 12/31/2019 | |||
| 1 | 2 | 3 | 4 | 5 | 6 | 7 |
| 1. Net tangible assets | 226 | 486 | 19.4 | 35.2 | +260 | +115 |
| 2. Net assets (Net worth) | 239 | 500 | 20.6 | 36.2 | +261 | +109.2 |
| 3. Stock capital | 440 | 400 | 37.9 | 29 | -40 | -9.1 |
| 4. Difference between net assets and stock capital (line 2 - line 3) | -201 | 100 | -17.3 | 7.2 | +301 | ↑ |
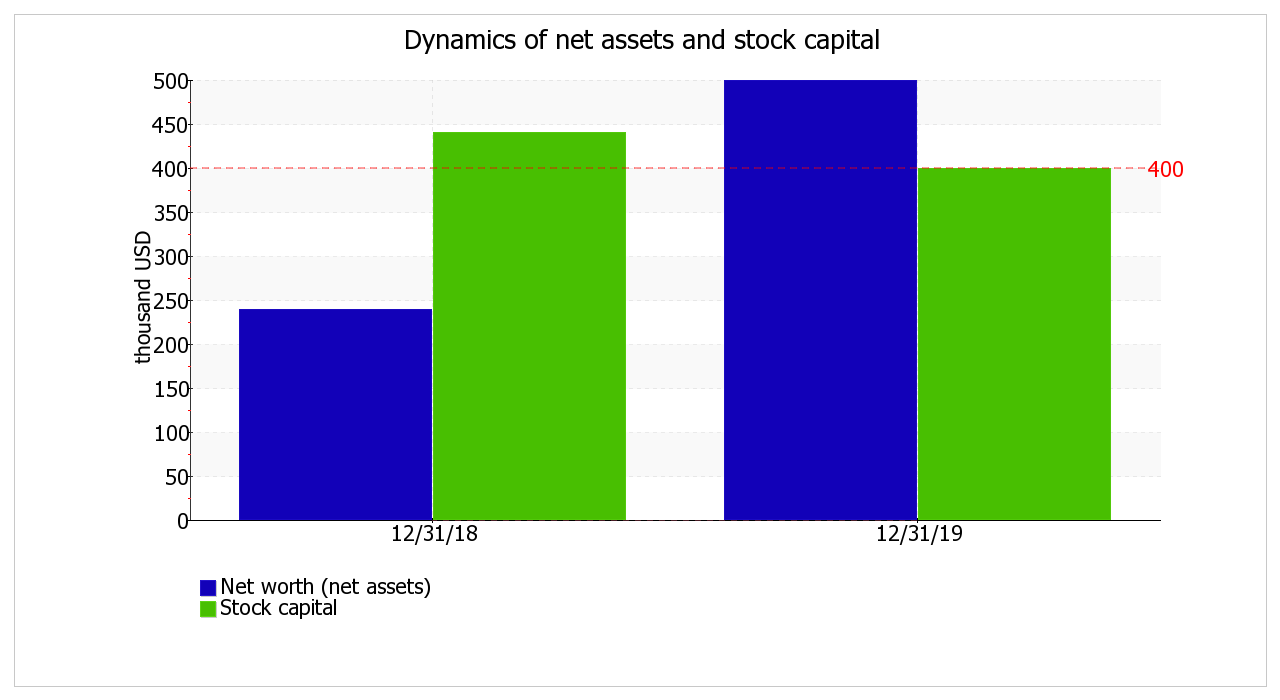
On 31 December, 2019, the net tangible assets amounted to USD 486 thousand, but the net tangible assets were much lower and equaled USD 226 thousand on the first day of the period analyzed (i.e. it grew by 115%). The intangible assets amounted to USD 14 thousand on 31 December, 2019. This value shows the difference between the value of net tangible assets and all net worth.
The net worth of Foodmaster exceeds the stock capital by 25% on 31 December, 2019. Such a situation is normal, the net worth (net assets) should not be less than the stock capital. Net worth is used as a measure of the company's book value (as opposed to a shareholder's value, the value based on expected earnings and other methods used to estimate the company's value). In financial analysis, amount of net worth (own equity) is one of the key indicators of property status of the company.
| Ratio | Value | Change (col.3-col.2) |
Description of the ratio and its recommended value | |
| 12/31/2018 | 12/31/2019 | |||
| 1 | 2 | 3 | 4 | 5 |
| Debt-to-equity ratio (financial leverage) | 3.86 | 1.76 | -2.1 | A debt-to-equity ratio is calculated by taking the total liabilities and dividing it by shareholders' equity. It is a key financial ratio and is used as a standard for judging a company's financial standing. Normal value: no more than 1.5 (optimum 0.43-1). |
| Debt ratio (debt to assets ratio) | 0.79 | 0.64 | -0.15 | A debt ratio is calculated by dividing total liabilities (i.e. long-term and short-term liabilities) by total assets. It shows how much the company relies on debt to finance assets (similar to debt-to-equity ratio). Acceptable value: 0.6 or less (optimum 0.3-0.5). |
| Long-term debt to Equity | 2.2 | 1.12 | -1.08 | This ratio is calculated by dividing long-term (noncurrent) liabilities by equity. |
| Noncurrent assets to Net worth | 3.61 | 1.81 | -1.8 | This ratio is calculated by dividing noncurrent assets by net worth (equity) and measures the extent of a company's investment in low-liquidity noncurrent assets. This ratio is important for comparison analysis because it's less dependent on industry (structure of company's assets) than debt ratio and debt-to-equity ratio. Acceptable value: 1.25 or less. |
| Capitalization ratio | 0.69 | 0.53 | -0.16 | Calculated by dividing noncurrent liabilities by the sum of equity and noncurrent liabilities. |
| Fixed assets to Net worth | 3.56 | 1.78 | -1.78 | This ratio indicates the extent to which the owners' cash is frozen in the form of fixed assets, such as property, plant, and equipment. Normal value: 0.75 or less. |
| Current liability ratio | 0.43 | 0.36 | -0.07 | Current liability ratio is calculated by dividing current liabilities by total (i.e. current and noncurrent) liabilities. |
The debt-to-equity ratio and debt ratio are the main coefficients describing financial stability. The ratios are similar in their meaning and indicate a relationship between two main sources of capital: equity and borrowed capital. The difference between the ratios is that the first one is calculated as a relationship of the borrowed capital (liabilities) to equity, while the second ratio is calculated as a relationship of the liabilities to the overall capital (i.e. the sum of equity and liabilities).
On 12/31/2019, the debt-to-equity equaled 1.76. For the entire period reviewed, the debt ratio fell and equaled 0.64.
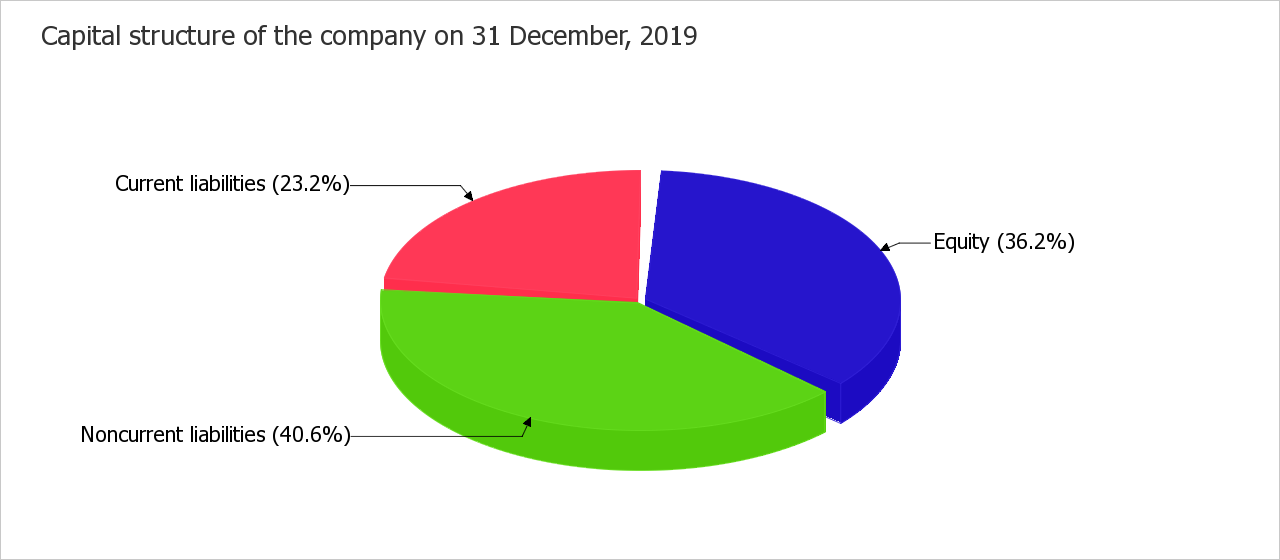
The value of the debt ratio negatively describes the financial position of Foodmaster at the end of the period analyzed, the percentage of liabilities is too high and equaled 63.8% of the company's total capital. The maximum acceptable percentage is 60%. Too higher dependence from creditors can lower the financial stability of the company, especially in the case of economic instability and crisis on the market of borrowed capital. It is recommended to keep the value of the debt ratio at a level of 0.6 or less (optimum 0.3-0.5).
In the chart below, one can see the structure of the company's capital:
According to well known principles for stable company development, investments with the least liquid assets (noncurrent assets) should first be made with help from the most long-term sources of financing, i.e. with the help of own capital (equity). An indicator of this rule is the noncurrent assets to net worth ratio. The ratio was equal to 1.81 on 31 December, 2019. During the year, the ratio dropped by 1.8. On the last day of the period analyzed, the value of the ratio is not a satisfactory one.
The current liability ratio equaled 0.36 on 31 December, 2019. It means that short-term and long-term liabilities take 36.4% and 63.6% respectively in the structure of the company's liabilities.
| Indicator | Value | Change for the period analyzed | ||
| 12/31/2018 | 12/31/2019 | (col.3-col.2) | % ((col.3-col.2) : col.2) |
|
| 1 | 2 | 3 | 4 | 5 |
| 1. Working capital (net working capital), thousand USD | -98 | +155 | +253 | ↑ |
| 2. Inventory, thousand USD | +2 | +43 | +41 | +21.5 times |
| 3. Working capital sufficiency (1-2), thousand USD | -100 | +112 | +212 | ↑ |
| 4. Inventory to working capital ratio (2:1) Normal value: no more than 1. | -0.02 | 0.28 | +0.3 | x |
The working capital was equal to USD 155 thousand on 12/31/2019. During the last year, the working capital was observed to grow quickly by USD 253 thousand. The table above shows that working capital exceeds the company's inventory by USD 112 thousand. At the end of the period analyzed, the inventory to working capital ratio was equal to 0.28. Such a correlation is deemed to be normal, although it can be achieved through warehouse inventory that is too low, but not through enough of long-term resources of financing in some cases.
Liquidity related ratios are one of the most widespread indicators of a company's solvency. The current ratio shows the capacity of a company to meet current liabilities with all available current assets. Quick ratio describes solvency in the near future. Cash ratio shows if there is enough means for uninterrupted execution of current transactions. Current ratio, quick ratio and cash ratio for Foodmaster are calculated in the following table.
| Liquidity ratio | Value | Change (col.3 - col.2) |
Description of the ratio and its recommended value | |
| 12/31/2018 | 12/31/2019 | |||
| 1 | 2 | 3 | 4 | 5 |
| 1. Current ratio (working capital ratio) | 0.75 | 1.48 | +0.73 | The current ratio is calculated by dividing current assets by current liabilities. It indicates a company's ability to meet short-term debt obligations. Acceptable value: 2 or more. |
| 2. Quick ratio (acid-test ratio) | 0.62 | 1.18 | +0.56 | The quick ratio is calculated by dividing liquid assets (cash, cash equivalents and short-term investments, current receivables) by current liabilities. It is a measure of a company's ability to meet its short-term obligations using its most liquid assets (near cash or quick assets). Acceptable value: 1 or more. |
| 3. Cash ratio | 0.59 | 1.07 | +0.48 | Cash ratio is calculated by dividing absolute liquid assets (cash, cash equivalents and short-term investments) by current liabilities.
Normal value: 0.2 or more. |
On the last day of the period analyzed, the current ratio was equal to 1.48. For the period reviewed, the current ratio was seen to rise sharply by 0.73. The value of the ratio can be considered as an unacceptable one on 12/31/2019.
During the year, the quick ratio went up significantly by 0.56 and showed 1.18. On 12/31/2019, the value of the quick ratio is very good. This means, Foodmaster is seen to have a normal relationship between liquid assets (current assets minus inventory) and current liabilities (liabilities with a maturity of less than 1 year).
On the last day of the period analyzed, the cash ratio demonstrates a very good value of 1.07. On 12/31/2019, the cash ratio equaled 1.07. The growth in the cash ratio was 0.48 for the period reviewed.
In the table below, you will find the main financial results of Foodmaster's activities for the last year and also for the same period as last year.
| Indicator | Value, thousand USD | Change | Average annual value, thousand USD |
||
| 2018 | 2019 | thousand USD (col.3 - col.2) |
± % (3-2) : 2 |
||
| 1 | 2 | 3 | 4 | 5 | 6 |
| 1. Revenues (Income) | 4,332 | 4,532 | +200 | +4.6 | 4,432 |
| 2. Cost of goods sold (Cost of revenue) | 1,222 | 3,241 | +2,019 | +165.2 | 2,232 |
| 3. Gross profit (1-2) | 3,110 | 1,291 | -1,819 | -58.5 | 2,201 |
| 4. Other income and expenses, except interest and finance costs and income tax expense | 187 | -252 | -439 | ↓ | -33 |
| 5. EBIT (3+4) | 3,297 | 1,039 | -2,258 | -68.5 | 2,168 |
| 5a. EBITDA | 3,970 | 1,823 | -2,147 | -54.1 | 2,897 |
| 6. Interest and finance costs | 1,450 | 22 | -1,428 | -98.5 | 736 |
| 7. Income tax expense | 40 | 12 | -28 | -70 | 26 |
| 8. Net income (loss) (3+4-6-7) | 1,807 | 1,005 | -802 | -44.4 | 1,406 |
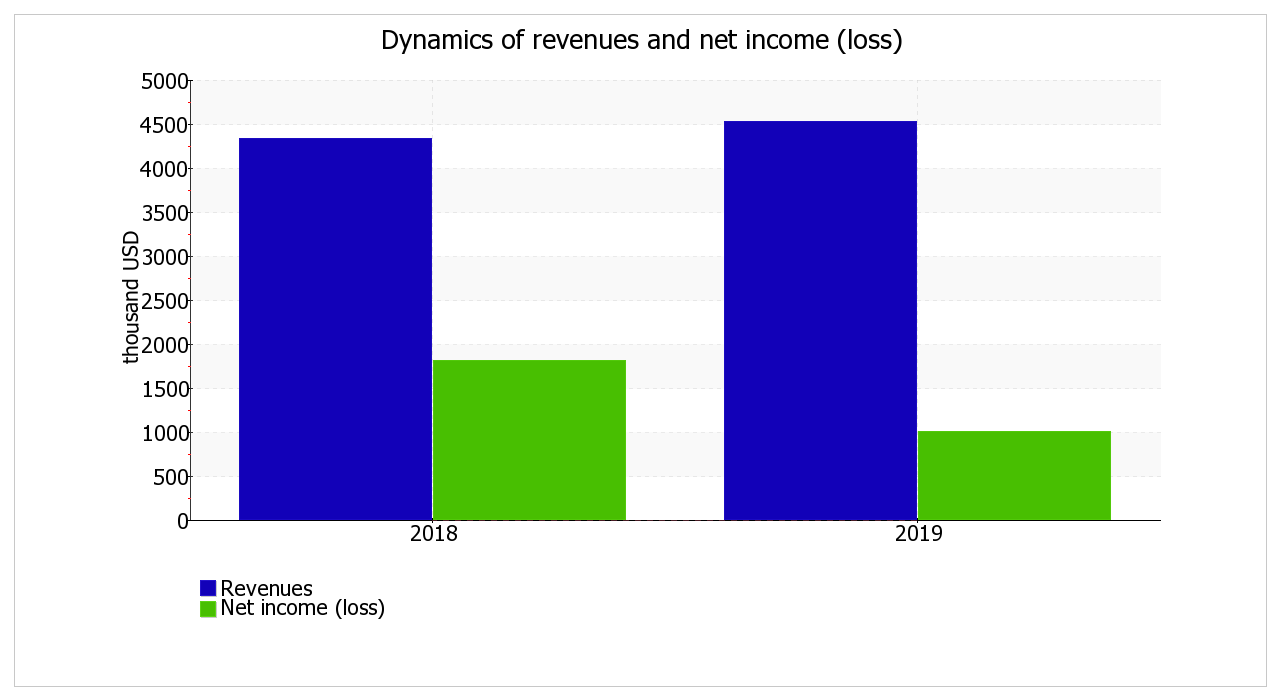
For the 2019, the revenue equaled USD 4,532 thousand, however the revenue was lower and equaled USD 4,332 thousand for the same period of the previous year (01.01–12/31/2018) ( the increase amounted to USD 200 thousand). The chart below demonstrates the change in revenue and net income (loss) including portion attributable to noncontrolling interest for Foodmaster. For the year 2019, the gross profit equaled USD 1,291 thousand. The gross profit reduced rapidly (by USD 1,819 thousand, or by 58.5%) in comparison with the previous financial year.
During the last year, the company posted a gross profit and earnings before interest and taxes (EBIT), which was USD 1,039 thousand. The total net income (including portion attributable to noncontrolling interest) showed USD 1,005 thousand during the last year.
| Profitability ratios | Value in % | Change (col.3 - col.2) |
|
| 2018 | 2019 | ||
| 1 | 2 | 3 | 4 |
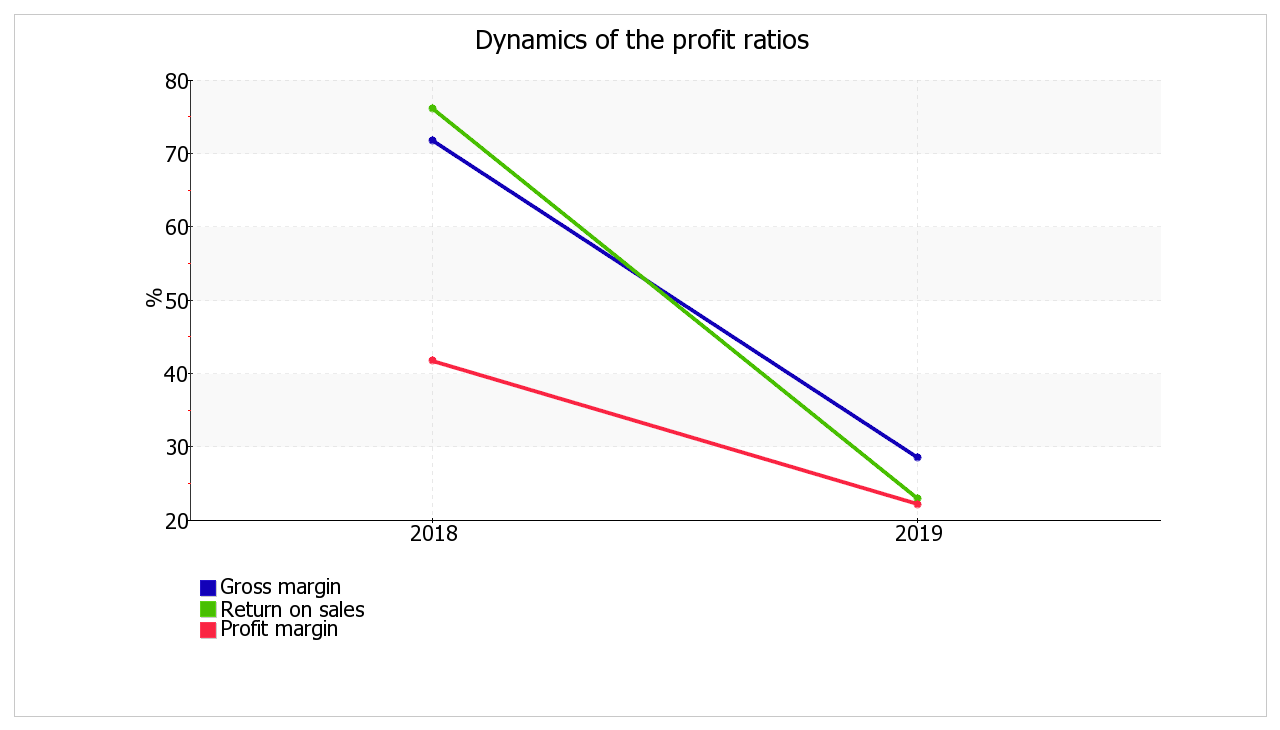
| 1. Gross margin. | 71.8 | 28.5 | -43.3 |
| 2. Return on sales (operating margin). | 76.1 | 22.9 | -53.2 |
| 3. Profit margin. | 41.7 | 22.2 | -19.5 |
| Reference: Interest coverage ratio (ICR). Normal value: 1.5 or more. |
2.3 | 47.2 | +45 |
The profitability ratios given in the table have positive values as a result of the profitability of Foodmaster's activities during the period analyzed (12/31/2018–12/31/2019). The gross margin amounted to 28.5% for the year, which is lower by 43.3% than for the same period of the previous year (01.01–12/31/2018).
Profitability calculated using EBIT (return on sales) deserves more attention. The return on sales was 0.23 or 22.9% per annum during the period 01.01–12/31/2019, while the profit margin was 22.2% per annum.
To assess the liabilities that the company should repay for the use of borrowed capital, an interest coverage ratio was calculated. The acceptable value is deemed to be not less than 1.5. In this case, the interest coverage ratio was 47.2 for the year, which is evidence of Foodmaster's capability to pay interest on borrowed assets. It should take into account that not all interest payments are necessarily included on the income statement. In certain cases interest is included in investments in noncurrent assets and as a result it is not used to calculate the indicated ratio.
| Profitability ratios | Value, % | Description of the ratio and its reference value |
| 2019 | ||
| 1 | 2 | 3 |
| Return on equity (ROE) | 272 | ROE is calculated by taking a year's worth of earnings (net income or loss) and dividing them by the average shareholder equity for that period, and is expressed as a percentage. It shows the companies ability to generate profits before leverage, rather than by using leverage. Normal value: 12% or more. |
| Return on assets (ROA) | 79.1 | ROA is calculated by dividing net income by total assets, and displayed as a percentage. Acceptable value: no less than 6%. |
| Return on capital employed (ROCE) | 113.9 | ROCE is calculated by dividing EBIT by capital employed (equity plus noncurrent liabilities). It indicates the efficiency and profitability of a company's capital investments. |
For the last year, the value of the return on assets equal to 79.1% can be characterised as extremely good.
One of the most important ratio of business profitability is the return on equity (ROE), which reflects the profitability of investments by the owners. The profitability of the owners' investments in Foodmaster's assets was 272% per annum during the year. It is a high rate, but it is influenced not only with factors inside the company, but also the economic environment where the company is located (inflation rate, interest rates, etc).
To assess Foodmaster's business activity, the table below provides the main rates of turnover: receivables, inventory, current and total assets turnovers; accounts payable and capital turnovers of the company. Turnover ratios have strong industry specifics and depend on activity. This is why an absolute value of the ratio does not permit making a qualitative assessment.
| Turnover ratio | Value, days | Ratio 2019 |
| 2019 | ||
| 1 | 2 | 3 |
| Receivables turnover (days sales outstanding) (average trade and other current receivables divided by average daily revenue*) |
2 | 197 |
| Accounts payable turnover (days payable outstanding) (average current payables divided by average daily purchases) |
34 | 10.8 |
| Inventory turnover (days inventory outstanding) (average inventory divided by average daily cost of sales) |
3 | 144 |
| Asset turnover (average total assets divided by average daily revenue) |
102 | 3.6 |
| Current asset turnover (average current assets divided by average daily revenue) |
31 | 11.7 |
| Capital turnover (average equity divided by average daily revenue) |
30 | 12.3 |
| Reference: Cash conversion cycle (days sales outstanding + days inventory outstanding - days payable outstanding) |
-29 | x |
For the year, the average collection period (Days Sales Outstanding) was 2 days and the average days payable outstanding was 34 days as shown in the table. The rate of asset turnover means that Foodmaster gains revenue equal to the sum of all the available assets every 102 days (on average for the period analyzed (2019)).
The labor productivity ratio was calculated using the information on the number of employees (the ratio of revenue from sales to the average number of employees).
For the last year, the labor productivity was equal to 259 thousand USD/employee.
The main financial state indicator values and Foodmaster's activity results are classified by qualitative assessment according to the results of the analysis for the year and are given below.
The analysis revealed the following extremely good financial characteristics:
The following values of Foodmaster's financial characteristics are good:
The following indicator is the financial characteristic with the value which borders on the edge of standard – earnings before interest and taxes (EBIT) were USD 1,039 thousand for the last year, although it compares negatively with the previous value (USD -2,258 thousand).
The analysis discovered the following unsatisfactory financial indicators:
|
|
||||||||||||||||||||||||||||||||||||||||||||||||||||||||||||||||||||||||||||||||||||||||||||||||||||||||||||||||||||||||||||||||||||
According to the results of the conducted analysis, the financial position for Foodmaster was assessed at a score scale in +0.11, which corresponds to the BB rating (normal position). The financial results of the company's activities were scored at +1.8 for the period reviewed (2019), which corresponds to the AAA rating (excellent results). One should tell that final scores are calculated considering both ratios at the end of the period analyzed and ratios dynamics, including their forecasted values for the next year. The final score of the financial condition, which includes analysis of the company's financial position and financial performance, makes +0.78, which equals the rating scale to a positive (BBB) condition.
A "BBB" rating shows a positive financial condition of a company and its' capability to meet their current liabilities. Companies with this rating are in the category of borrower, those who can obtain credit with high probability (good creditworthiness).
It should be mentioned that this rating is calculated by analysing financial data for the period analyzed (12/31/2018–12/31/2019). However it is necessary to make an analysis of a company's activity for at least the last 2-3 years to obtain enough reliable results.
The Altman Z-score is one of the values predicting the company's bankruptcy in the near future and is calculated in the following manner (a 4-factor model for a private non-manufacturer is taken for Foodmaster):
Z-score = 6.56T1 + 3.26T2 + 6.72T3 + 1.05T4 , where
| Ratio | Calculation | Ratio value on 12/31/2019 | Weighting factor | Product (col. 3 x col. 4) |
| 1 | 2 | 3 | 4 | 5 |
| T1 | Working Capital / Total Assets | +0.11 | 6.56 | +0.74 |
| T2 | Retained Earnings / Total Assets | +0.07 | 3.26 | +0.24 |
| T3 | Earnings Before Interest and Taxes / Total Assets | +0.75 | 6.72 | +5.06 |
| T4 | Equity / Total Liabilities | +0.57 | 1.05 | +0.6 |
| Altman Z-score: | +6.63 | |||
Discrimination ranges:
Foodmaster's Z-score was 6.63 on the last day of the period analyzed. It means that the probability of Foodmaster's bankruptcy is insignificant.
Another bankruptcy forecast algorithm is Taffler Model, which has the following formula:
Z = 0,53X1 + 0,13X2 + 0,18X3 + 0,16X4 , where
| Ratio | Calculation | Ratio value on 12/31/2019 | Weighting factor | Product (col. 3 х col. 4) |
| 1 | 2 | 3 | 4 | 5 |
| X1 | Gross profit / Current liabilities | 4.03 | 0,53 | 2.14 |
| X2 | Current assets / Total liabilities | 0.54 | 0,13 | 0.07 |
| X3 | Current liabilities / Total assets | 0.34 | 0,18 | 0.06 |
| X4 | Revenue from sales / Total assets | 3.28 | 0,16 | 0.53 |
| Taffler Z-score: | 2.8 | |||
Function values are interpreted as follows:
Final score according to Taffler Model is 2.8. So there is a low probability of bankruptcy risk.
| Ratio | Weighting factor | Score | Average score (col.3 x 0.25 + col.4 x 0.6 + col.5 x 0.15) |
Weighted average score (col.2 x col.6) |
||
| past | present | future | ||||
| 1 | 2 | 3 | 4 | 5 | 6 | 7 |
| I. Rating of the company's financial position | ||||||
| Debt ratio | 0.3 | -1 | -1 | +2 | -0.55 | -0.165 |
| Noncurrent assets to net worth | 0.15 | -2 | -1 | +2 | -0.8 | -0.12 |
| Current ratio | 0.2 | -2 | -1 | +2 | -0.8 | -0.16 |
| Quick ratio | 0.2 | -1 | +2 | +2 | +1.25 | +0.25 |
| Cash ratio | 0.15 | +2 | +2 | +2 | +2 | +0.3 |
| Total | 1 | Final score (in total col.7 : col. 2): | +0.105 | |||
| II. Rating of the company's financial performance | ||||||
| Return on equity (ROE) | 0.5 | +2 | +2 | +2 | +2 | +1 |
| Return on assets (ROA) | 0.3 | +2 | +2 | +2 | +2 | +0.6 |
| Sales growth | 0.2 | +1 | +1 | +1 | +1 | +0.2 |
| Total | 1 | Final score (in total col.7 : col. 2): | +1.8 | |||
Final rating score for Foodmaster's financial condition: (+0.105 x 0,6) + (+1.8 x 0,4) = +0.78 (BBB - positive)
Reference: Financial condition scale
| Total score | Sign | The qualitative assessment of a financial condition | |
| from |
to (inclusive) |
||
| 2 | 1.6 | AAA | Excellent |
| 1.6 | 1.2 | AA | Very good |
| 1.2 | 0.8 | A | Good |
| 0.8 | 0.4 | BBB | Positive |
| 0.4 | 0 | BB | Normal |
| 0 | -0.4 | B | Satisfactory |
| -0.4 | -0.8 | CCC | Unsatisfactory |
| -0.8 | -1.2 | CC | Adverse |
| -1.2 | -1.6 | C | Bad |
| -1.6 | -2 | D | Critical |