The analysis represented below on Heavytruck's financial state and activity efficiency is made for the period 04/01/2016–03/31/2018 based on the financial statements data prepared in accordance with standards generally accepted in the United States of America (US GAAP).
| Indicator | Value | Change for the period analyzed | |||||
| in thousand USD | % of the balance total | thousand USD (col.4-col.2) |
± % ((col.4-col.2) : col.2) |
||||
| 03/31/2016 | 03/31/2017 | 03/31/2018 | at the beginning of the period analyzed (03/31/2016) |
at the end of the period analyzed (03/31/2018) |
|||
| 1 | 2 | 3 | 4 | 5 | 6 | 7 | 8 |
| Assets | |||||||
| 1. Current assets, total | 1,045,043 | 1,075,564 | 1,322,699 | 26.8 | 32 | +277,656 | +26.6 |
| 623,456 | 29,772 | 826,263 | 16 | 20 | +202,807 | +32.5 | |
| 234,425 | 926,663 | 224,422 | 6 | 5.4 | -10,003 | -4.3 | |
| 23,443 | 42,344 | 86,726 | 0.6 | 2.1 | +63,283 | +3.7 times | |
| 2. Noncurrent assets | 2,856,968 | 3,835,662 | 2,812,819 | 73.2 | 68 | -44,149 | -1.5 |
| Liabilities and Equity | |||||||
| 1. Current liabilities | 761,390 | 1,175,627 | 1,022,802 | 19.5 | 24.7 | +261,412 | +34.3 |
| 2. Noncurrent liabilities | 2,211,302 | 1,781,172 | 1,412,895 | 56.7 | 34.2 | -798,407 | -36.1 |
| 3. Stockholders' equity | 919,919 | 1,939,995 | 1,690,413 | 23.6 | 40.9 | +770,494 | +83.8 |
| 4. Other capital (temporary equity, commitments and contingencies) | 9,400 | 14,432 | 9,408 | 0.2 | 0.2 | -910,511 | -99 |
| Assets; Liabilities and Equity | 3,902,011 | 4,911,226 | 4,135,518 | 100 | 100 | +233,507 | +6 |
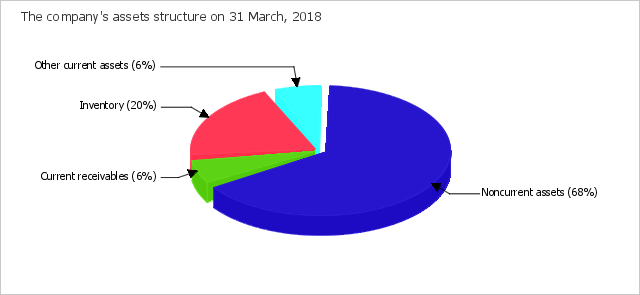
According to the data given in the table, noncurrent assets were about two thirds of Heavytruck's assets (68%) on the last day of the period analyzed, while current assets took one third. The assets appreciably grew to USD 4,135,518 thousand (by USD 233,507 thousand, or by 6%) during the period analyzed (from 31 March, 2016 to 31 March, 2018). Assets were observed to grow simultaneously with equity. With that, the equity has grown with outrunning rates (+83.8% for the entire period reviewed). An outrunning growth of equity is a factor with positive influence on the financial stability of Heavytruck.
The increase in total assets of Heavytruck occurred due to the growth of the following asset types (amount of change and percentage of this change relative to the total assets growth are shown below):
The most significant growth of sources of finance ("Equity and Liabilities") is seen on the following rates (the percentage from total equity and liabilities change is shown in brackets):
The most significantly changed items on the balance sheet for the period reviewed (from 31 March, 2016 to 31 March, 2018) are "Property, plant and equipment, net" in assets and "Long-term debt and lease obligations" in sources of finance (USD -279,729 thousand and USD -436,211 thousand, respectively).
The inventory were USD 826,263 thousand on the last day of the period analyzed (03/31/2018), which significantly (by USD 202,807 thousand, or by 32.5%) exceeds the level on the first day of the period analyzed.
During the last two years, the current receivables moderately reduced (USD -10,003 thousand).
| Indicator | Value | Change | |||||
| in thousand USD | % of the balance total | thousand USD (col.3-col.2), |
%, ((col.3 -col.2) : col.2) | ||||
| at the beginning of the period analyzed (03/31/2016) | at the end of the period analyzed (03/31/2018) | 03/31/2016 | 03/31/2017 | 03/31/2018 | |||
| 1 | 2 | 3 | 4 | 5 | 6 | 7 | 8 |
| 1. Net tangible assets | 848,914 | 1,578,362 | 21.8 | 33 | 38.2 | +729,448 | +85.9 |
| 2. Net assets (Net worth) | 919,919 | 1,690,413 | 23.6 | 39.5 | 40.9 | +770,494 | +83.8 |
| 3. Stock capital | 554,345 | 1,373,664 | 14.2 | 27.2 | 33.2 | +819,319 | +147.8 |
| 4. Difference between net assets and stock capital (line 2 - line 3) | 365,574 | 316,749 | 9.4 | 12.3 | 7.7 | -48,825 | -13.4 |
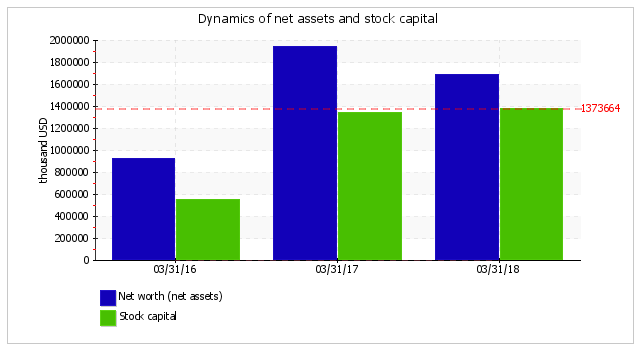
On the last day of the period analyzed (03/31/2018), the net tangible assets equaled USD 1,578,362 thousand. During the period reviewed (31.03.16–31.03.18), the net tangible assets grew by USD 729,448 thousand, or by 86%. On 03/31/2018, the intangible assets equaled USD 112,051 thousand. This value shows the difference between the value of net tangible assets and all net worth.
The net worth of Heavytruck exceeds the stock capital by 23.1% on the last day of the period analyzed (03/31/2018). Such a situation is normal, the net worth (net assets) should not be less than the stock capital. Net worth is used as a measure of the company's book value (as opposed to a shareholder's value, the value based on expected earnings and other methods used to estimate the company's value). In financial analysis, amount of net worth (own equity) is one of the key indicators of property status of the company.
| Ratio | Value | Change (col.4-col.2) |
Description of the ratio and its recommended value | ||
| 03/31/2016 | 03/31/2017 | 03/31/2018 | |||
| 1 | 2 | 3 | 4 | 5 | 6 |
| Debt-to-equity ratio (financial leverage) | 3.23 | 1.52 | 1.44 | -1.79 | A debt-to-equity ratio is calculated by taking the total liabilities and dividing it by shareholders' equity. It is a key financial ratio and is used as a standard for judging a company's financial standing. Normal value: no more than 1.5 (optimum 0.43-1). |
| Debt ratio (debt to assets ratio) | 0.76 | 0.6 | 0.59 | -0.17 | A debt ratio is calculated by dividing total liabilities (i.e. long-term and short-term liabilities) by total assets. It shows how much the company relies on debt to finance assets (similar to debt-to-equity ratio). Normal value: 0.6 or less (optimum 0.3-0.5). |
| Long-term debt to Equity | 2.4 | 0.92 | 0.84 | -1.56 | This ratio is calculated by dividing long-term (noncurrent) liabilities by equity. |
| Noncurrent assets to Net worth | 3.11 | 1.98 | 1.66 | -1.45 | This ratio is calculated by dividing noncurrent assets by net worth (equity) and measures the extent of a company's investment in low-liquidity noncurrent assets. This ratio is important for comparison analysis because it's less dependent on industry (structure of company's assets) than debt ratio and debt-to-equity ratio. Normal value: 1.25 or less. |
| Capitalization ratio | 0.71 | 0.48 | 0.46 | -0.25 | Calculated by dividing noncurrent liabilities by the sum of equity and noncurrent liabilities. |
| Fixed assets to Net worth | 2.85 | 1.41 | 1.39 | -1.46 | This ratio indicates the extent to which the owners' cash is frozen in the form of fixed assets, such as property, plant, and equipment. Acceptable value: 0.75 or less. |
| Current liability ratio | 0.26 | 0.4 | 0.42 | +0.16 | Current liability ratio is calculated by dividing current liabilities by total (i.e. current and noncurrent) liabilities. |
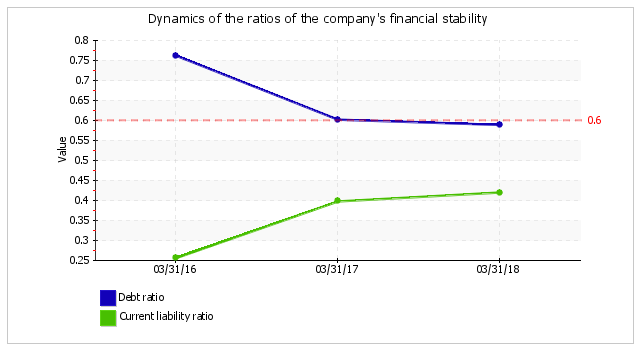
The debt-to-equity ratio and debt ratio are the main coefficients describing financial stability. The ratios are similar in their meaning and indicate a relationship between two main sources of capital: equity and borrowed capital. The difference between the ratios is that the first one is calculated as a relationship of the borrowed capital (liabilities) to equity, while the second ratio is calculated as a relationship of the liabilities to the overall capital (i.e. the sum of equity and liabilities).
At the end of the period reviewed, the debt-to-equity was equal to 1.44. During the period analyzed (31.03.16–31.03.18), the debt ratio decreased by 0.17 from 0.76 to 0.59.
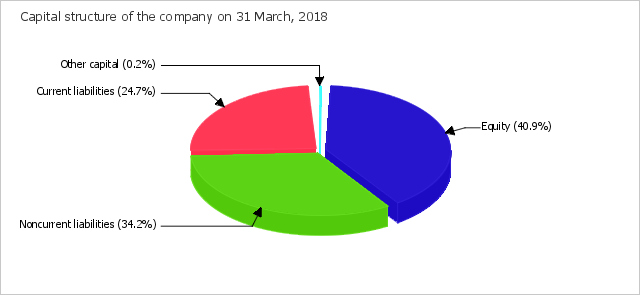
The value of the debt ratio relates to Heavytruck's good capital structure on 31 March, 2018 from the point of view of financial stability. The percentages of liability and equity are 59.1% and 40.9%, respectively. Despite the fact that at the beginning of the considered period, the value of the debt ratio did not correspond to the norm, later it became normal.
In the chart below, one can see the structure of the company's capital:
According to well known principles for stable company development, investments with the least liquid assets (noncurrent assets) should first be made with help from the most long-term sources of financing, i.e. with the help of own capital (equity). An indicator of this rule is the noncurrent assets to net worth ratio. On 31 March, 2018, the ratio equaled 1.66. For the last two years, the ratio decreased by 1.45. The value of the ratio can be characterised as an unacceptable one on 03/31/2018.
The current liability ratio shows that the share of short-term and long-term liabilities of total liabilities of Heavytruck equaled 42% and 58% respectively on 31 March, 2018.
The following chart shows the dynamics of the debt and current liability ratios of Heavytruck.
| Indicator | Value | Change for the period analyzed | |||
| 03/31/2016 | 03/31/2017 | 03/31/2018 | (col.4-col.2) | % ((col.4-col.2) : col.2) |
|
| 1 | 2 | 3 | 4 | 5 | 6 |
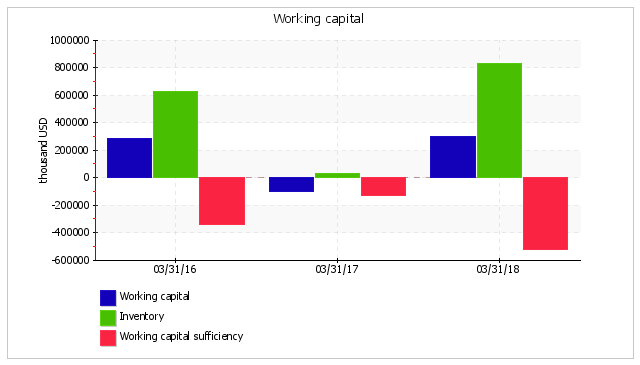
| 1. Working capital (net working capital), thousand USD | +283,653 | -100,063 | +299,897 | +16,244 | +5.7 |
| 2. Inventory, thousand USD | +623,456 | +29,772 | +826,263 | +202,807 | +32.5 |
| 3. Working capital sufficiency (1-2), thousand USD | -339,803 | -129,835 | -526,366 | -186,563 | ↓ |
| 4. Inventory to working capital ratio (2:1) Acceptable value: no more than 1. | 2.2 | -0.3 | 2.76 | +0.56 | x |
The working capital was equal to USD 299,897 thousand at the end of the period reviewed. For the period reviewed (from 31 March, 2016 to 31 March, 2018), the working capital climbed appreciably (USD +16,244 thousand). But if we compare working capital with inventory, it turns out that inventory is not covered with working capital in full on the last day of the period analyzed (03/31/2018) (deficit is USD 526,366 thousand). It is an abnormal situation which can be caused by one of two factors: a shortage of long-term sources of financing or warehouse inventory that is too large. The value of working capital is deemed to be optimal when it is not lower than inventory which is the least liquid component of current assets.
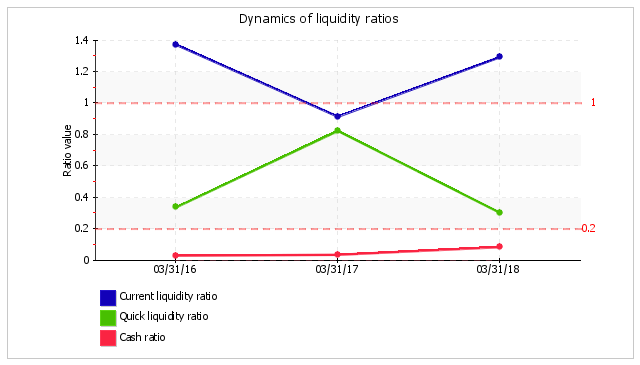
Liquidity related ratios are one of the most widespread indicators of a company's solvency. The current ratio shows the capacity of a company to meet current liabilities with all available current assets. Quick ratio describes solvency in the near future. Cash ratio shows if there is enough means for uninterrupted execution of current transactions. Current ratio, quick ratio and cash ratio for Heavytruck are calculated in the following table.
| Liquidity ratio | Value | Change (col.4 - col.2) |
Description of the ratio and its recommended value | ||
| 03/31/2016 | 03/31/2017 | 03/31/2018 | |||
| 1 | 2 | 3 | 4 | 5 | 6 |
| 1. Current ratio (working capital ratio) | 1.37 | 0.91 | 1.29 | -0.08 | The current ratio is calculated by dividing current assets by current liabilities. It indicates a company's ability to meet short-term debt obligations. Acceptable value: 2 or more. |
| 2. Quick ratio (acid-test ratio) | 0.34 | 0.82 | 0.3 | -0.04 | The quick ratio is calculated by dividing liquid assets (cash, cash equivalents and short-term investments, current receivables) by current liabilities. It is a measure of a company's ability to meet its short-term obligations using its most liquid assets (near cash or quick assets). Acceptable value: 1 or more. |
| 3. Cash ratio | 0.03 | 0.04 | 0.08 | +0.05 | Cash ratio is calculated by dividing absolute liquid assets (cash, cash equivalents and short-term investments) by current liabilities.
Normal value: no less than 0.2. |
During the two years, it was observed that there was a a significant lowering in the current ratio to 1.29 (-0.08). The value of the ratio can be deemed as an unacceptable one at the end of the period analyzed. During the whole of the analyzed period, the current ratio kept a value outside the normal range.
During the period analyzed, the quick ratio dropped from 0.34 to 0.3 (-0.04). The value of the quick ratio is critical on 03/31/2018. It means that Heavytruck does not have enough liquid assets (cash and other assets which can be rapidly sold) to meet all their current liabilities.
Similar to the two previous ratios, the cash ratio has an unsatisfactory value (0.08) on the last day of the period analyzed that describes the lack of the most liquid assets in the company (cash and cash equivalents) to meet all current liabilities.
The table below tells us about the main financial results of Heavytruck's activities during the period analyzed (from 31 March, 2016 to 31 March, 2018).
| Indicator | Value, thousand USD | Change | Average annual value, thousand USD |
||
| 2016/17 | 2017/18 | thousand USD (col.3 - col.2) |
± % (3-2) : 2 |
||
| 1 | 2 | 3 | 4 | 5 | 6 |
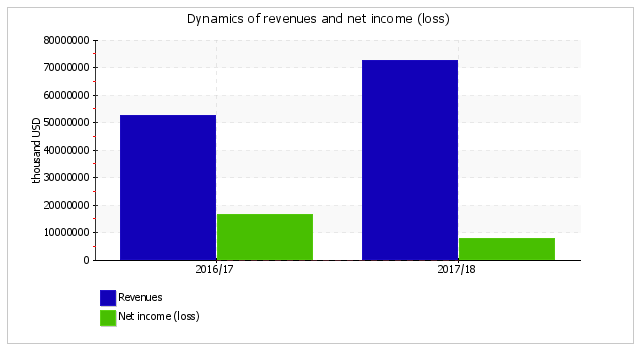
| 1. Revenues | 52,644,823 | 72,664,826 | +20,020,003 | +38 | 62,654,825 |
| 2. Cost of revenue | 27,828,183 | 57,828,183 | +30,000,000 | +107.8 | 42,828,183 |
| 3. Gross profit (1-2) | 24,816,640 | 14,836,643 | -9,979,997 | -40.2 | 19,826,642 |
| 4. Other income and expenses from continuing operations, except interest and debt expense and income tax expense | -1,294,186 | -1,415,121 | -120,935 | ↓ | -1,354,654 |
| 5. EBIT (3+4) | 23,522,454 | 13,421,522 | -10,100,932 | -42.9 | 18,471,988 |
| 5a. EBITDA | 26,966,710 | 15,765,944 | -11,200,766 | -41.5 | 21,366,327 |
| 6. Interest and debt expense | 4,066,430 | 4,566,634 | +500,204 | +12.3 | 4,316,532 |
| 7. Income tax expense (benefit) | 3,455,533 | 1,134,556 | -2,320,977 | -67.2 | 2,295,045 |
| 8. Income (Loss) from Continuing Operations (5-6-7) | 16,000,491 | 7,720,332 | -8,280,159 | -51.7 | 11,860,412 |
| 9. Income (loss) from discontinued operations and extraordinary item | 606,810 | 30,007 | -576,803 | -95.1 | 318,409 |
| 10. Net income (loss), including portion attributable to noncontrolling interest (8+9) | 16,607,301 | 7,750,339 | -8,856,962 | -53.3 | 12,178,820 |
| 11. Comprehensive income (loss), attributable to parent |
16,071,191 | 7,786,218 | -8,284,973 | -51.6 | 11,928,705 |
The revenue grew from USD 52,644,823 thousand to USD 72,664,826 thousand (by USD 20,020,003 thousand, or by 38%) during the two years. The chart below demonstrates the change in revenue and net income (loss) including portion attributable to noncontrolling interest for Heavytruck. The gross profit equaled USD 14,836,643 thousand for the last year. For the entire period analyzed, the gross profit decreased notably (by USD 9,979,997 thousand, or by 40.2%).
For the last year, the company posted a gross profit and earnings before interest and taxes (EBIT), which was USD 13,421,522 thousand. The final net income (including portion attributable to noncontrolling interest) of Heavytruck equaled USD 7,750,339 thousand for the last year.
| Profitability ratios | Value in % | Change (col.3 - col.2) |
|
| 2016/17 | 2017/18 | ||
| 1 | 2 | 3 | 4 |
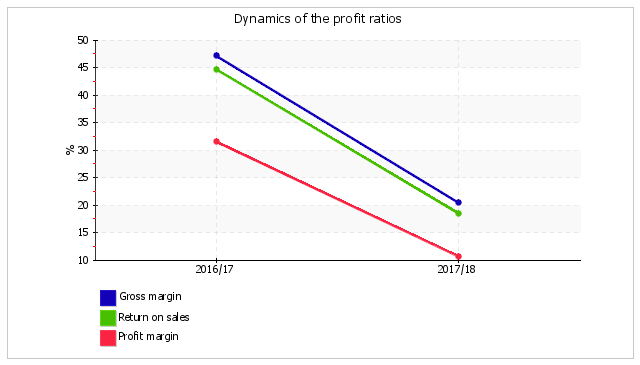
| 1. Gross margin. | 47.1 | 20.4 | -26.7 |
| 2. Return on sales (operating margin). | 44.7 | 18.5 | -26.2 |
| 3. Profit margin. | 31.5 | 10.7 | -20.8 |
| Reference: Interest coverage ratio (ICR). Normal value: no less than 1.5. |
5.8 | 2.9 | -2.8 |
The profitability ratios given in the table have positive values as a result of the profitability of Heavytruck's activities for the year 2017/18. During the year 2017/18, the gross margin was equal to 20.4%; it is 26.7% lower than for the year 2016/17.
Profitability calculated using EBIT (return on sales) deserves more attention. The return on sales was 0.18 or 18.5% per annum during the last year, while the profit margin was 10.7% per annum.
To assess the liabilities that the company should repay for the use of borrowed capital, an interest coverage ratio was calculated. The acceptable value is deemed to be not less than 1.5. In this case, the interest coverage ratio was 2.9 during the year 2017/18, which is evidence of Heavytruck's capability to pay interest on borrowed assets. It should take into account that not all interest payments are necessarily included on the income statement. In certain cases interest is included in investments in noncurrent assets and as a result it is not used to calculate the indicated ratio.
| Profitability ratios | Value, % | Change (col.3 - col.2) |
Description of the ratio and its reference value | |
| 2016/17 | 2017/18 | |||
| 1 | 2 | 3 | 4 | 5 |
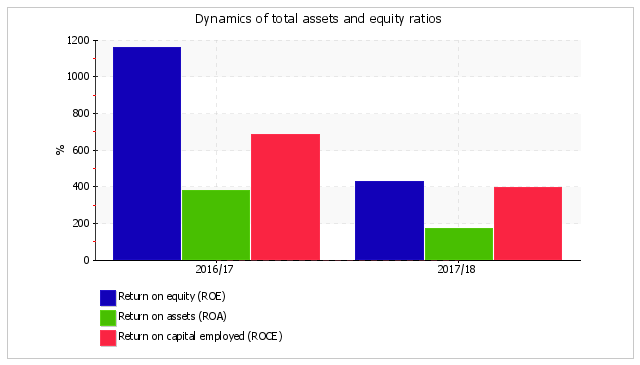
| Return on equity (ROE) | 1,161.4 | 427 | -734.4 | ROE is calculated by taking a year's worth of earnings (net income or loss) and dividing them by the average shareholder equity for that period, and is expressed as a percentage. It shows the companies ability to generate profits before leverage, rather than by using leverage. Acceptable value: 12% or more. |
| 1,123.9 | 428.9 | -695 | This ratio is similar to the previous one, but is calculated using comprehensive income instead of net income. Acceptable value: 12% or more. | |
| Return on assets (ROA) | 376.9 | 171.3 | -205.6 | ROA is calculated by dividing net income by total assets, and displayed as a percentage. Acceptable value: 6% or more. |
| 364.7 | 172.1 | -192.6 | This ratio is similar to the previous one, but is calculated using comprehensive income instead of net income. Normal value: no less than 6%. | |
| Return on capital employed (ROCE) | 686.5 | 393.3 | -293.2 | ROCE is calculated by dividing EBIT by capital employed (equity plus noncurrent liabilities). It indicates the efficiency and profitability of a company's capital investments. |
The return on assets was equal to 171.3% for the period from 04/01/2017 to 03/31/2018. During the whole period reviewed, the return on assets went down by 205.6%.
A key indicator of business profitability is the return of equity (ROE), i.e. return from money invested by the owners. The profitability of the owners' investments in Heavytruck's assets was 427% per annum during the year 2017/18. It is a high rate, but it is influenced not only with factors inside the company, but also the economic environment where the company is located (inflation rate, interest rates, etc).
The change in the main rates of return on assets and equity of Heavytruck is demonstrated in the following chart for the period analyzed.
To assess Heavytruck's business activity, the table below provides the main rates of turnover: receivables, inventory, current and total assets turnovers; accounts payable and capital turnovers of the company. Turnover ratios have strong industry specifics and depend on activity. This is why an absolute value of the ratio does not permit making a qualitative assessment. When assets turnover ratios are analyzed, an increase in ratios (i.e. velocity of circulation) and a reduction in circulation days are deemed to be positive dynamics. There is no well-defined interaction for accounts payable and capital turnover. In any case, an accurate conclusion can only be made only after the reasons that caused these changes are considered.
| Turnover ratio | Value, days | Ratio 2016/17 |
Ratio 2017/18 |
Change, days (col.3 - col.2) |
|
| 2016/17 | 2017/18 | ||||
| 1 | 2 | 3 | 4 | 5 | 6 |
| Receivables turnover (days sales outstanding) (average trade and other current receivables divided by average daily revenue*) |
4 | 3 | 90.7 | 126.3 | -1 |
| Accounts payable turnover (days payable outstanding) (average current payables divided by average daily purchases) |
12 | 6 | 30.8 | 59.6 | -6 |
| Inventory turnover (days inventory outstanding) (average inventory divided by average daily cost of sales) |
4 | 3 | 85.2 | 135.1 | -1 |
| Asset turnover (average total assets divided by average daily revenue) |
31 | 23 | 11.9 | 16.1 | -8 |
| Current asset turnover (average current assets divided by average daily revenue) |
7 | 6 | 49.7 | 60.6 | -1 |
| Capital turnover (average equity divided by average daily revenue) |
10 | 9 | 36.8 | 40 | -1 |
| Reference: Cash conversion cycle (days sales outstanding + days inventory outstanding - days payable outstanding) |
-4 | -1 | x | x | +3 |
According to the above table, the average collection period (Days Sales Outstanding), calculated based on the data during the year 2017/18, was 3 days, while average repayment period for credit debts (Days Payable Outstanding) was 6 days. The data on asset turnover, on average, for the entire period analyzed, shows that Heavytruck gains revenue equal to the sum of all the assets every 27 days.
Labor productivity is calculated as one of the indicators of the efficiency of labor utilization – the ratio of revenue from sales to the average number of employees. The graph below shows the dynamics of this ratio during the last two years.
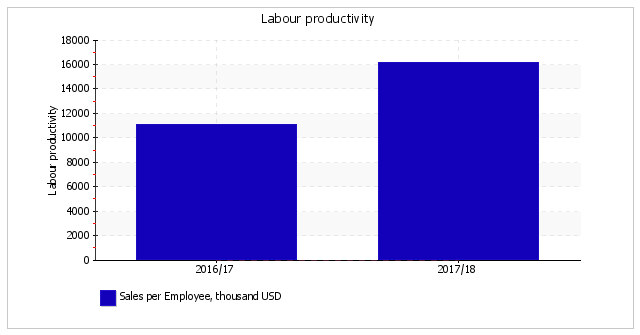
The labor productivity was found to go up from 11,083 thousand USD/employee to 16,148 thousand USD/employee for the entire period analyzed.
The most important indicators of Heavytruck's financial state and activity results are summarized below by using a qualitative assessment during the period reviewed (31.03.16–31.03.18).
The analysis discovered the following extremely good financial characteristics:
Financial characteristics with acceptable values are indicated below:
There is one characteristic with a marginally acceptable value obtained during the analysis – earnings before interest and taxes (EBIT) showed USD 13,421,522 thousand during the last year, but it compares negatively with the previous value (USD -10,100,932 thousand).
Financial indicators with negative values are the following:
We found only one characteristic with a critical value during the analysis – liquid assets (current assets minus inventory) are certainly not enough to meet current liabilities (quick ratio is equal to 0.3, while the acceptable value is 1).
|
|
||||||||||||||||||||||||||||||||||||||||||||||||||||||||||||||||||||||||||||||||||||||||||||||||||||||||||||||||||||||||||||||||||||
According to the analytical results given above, the following qualitative assessments were calculated: Heavytruck's financial position score is -0.66; the financial performance score during the period reviewed (31.03.16–31.03.18) is +1.52. According to the rating scale, it is CCC (unsatisfactory position) and AA (very good financial performance), respectively. These scores are obtained considering both key ratios at the end of the period analyzed and the dynamics of the rates, including their expected values for the next year. Based on these two scores, the final rating score of Heavytruck's financial condition was calculated. The financial condition was assessed at the BB rate (normal).
"BB" describes the financial condition of a company when the majority of ratios are normal. Companies with this rating should be considered as business partners who will need to be treated carefully when managing risks. These companies can lay a claim to obtain credit but a decision mainly depends on the analysis of additional factors (neutral creditworthiness).
The Altman Z-score was calculated to predict the probability of the company's bankruptcy (a 4-factor model for a private non-manufacturer is taken for Heavytruck):
Z-score = 6.56T1 + 3.26T2 + 6.72T3 + 1.05T4 , where
| Ratio | Calculation | Ratio value on 03/31/2018 | Weighting factor | Product (col. 3 x col. 4) |
| 1 | 2 | 3 | 4 | 5 |
| T1 | Working Capital / Total Assets | +0.07 | 6.56 | +0.48 |
| T2 | Retained Earnings / Total Assets | +0.02 | 3.26 | +0.06 |
| T3 | Earnings Before Interest and Taxes / Total Assets | +3.25 | 6.72 | +21.81 |
| T4 | Equity / Total Liabilities | +0.69 | 1.05 | +0.73 |
| Altman Z-score: | +23.07 | |||
Discrimination ranges:
According to calculations, on 03/31/2018, the Z-score equaled 23.07 for Heavytruck. Such a value says about the insignificant probability of Heavytruck's bankruptcy.
Another bankruptcy forecast algorithm is Taffler Model, which has the following formula:
Z = 0,53X1 + 0,13X2 + 0,18X3 + 0,16X4 , where
| Ratio | Calculation | Ratio value on 03/31/2018 | Weighting factor | Product (col. 3 х col. 4) |
| 1 | 2 | 3 | 4 | 5 |
| X1 | Gross profit / Current liabilities | 14.51 | 0,53 | 7.69 |
| X2 | Current assets / Total liabilities | 0.54 | 0,13 | 0.07 |
| X3 | Current liabilities / Total assets | 0.32 | 0,18 | 0.06 |
| X4 | Revenue from sales / Total assets | 17.57 | 0,16 | 2.81 |
| Taffler Z-score: | 10.63 | |||
Function values are interpreted as follows:
Final score according to Taffler Model is 10.63. So there is a low probability of bankruptcy risk.
| Ratio | Weighting factor | Score | Average score (col.3 x 0.25 + col.4 x 0.6 + col.5 x 0.15) |
Weighted average score (col.2 x col.6) |
||
| past | present | future | ||||
| 1 | 2 | 3 | 4 | 5 | 6 | 7 |
| I. Rating of the company's financial position | ||||||
| Debt ratio | 0.3 | -1 | +1 | +2 | +0.65 | +0.195 |
| Noncurrent assets to net worth | 0.15 | -2 | -1 | +2 | -0.8 | -0.12 |
| Current ratio | 0.2 | -1 | -1 | -1 | -1 | -0.2 |
| Quick ratio | 0.2 | -1 | -2 | -2 | -1.75 | -0.35 |
| Cash ratio | 0.15 | -2 | -1 | -1 | -1.25 | -0.188 |
| Total | 1 | Final score (in total col.7 : col. 2): | -0.663 | |||
| II. Rating of the company's financial performance | ||||||
| Return on equity (ROE) | 0.5 | +2 | +2 | -2 | +1.4 | +0.7 |
| Return on assets (ROA) | 0.3 | +2 | +2 | -2 | +1.4 | +0.42 |
| Sales growth | 0.2 | +2 | +2 | +2 | +2 | +0.4 |
| Total | 1 | Final score (in total col.7 : col. 2): | +1.52 | |||
Final rating score for Heavytruck's financial condition: (-0.663 x 0,6) + (+1.52 x 0,4) = +0.21 (BB - normal)
Reference: Financial condition scale
| Total score | Sign | The qualitative assessment of a financial condition | |
| from |
to (inclusive) |
||
| 2 | 1.6 | AAA | Excellent |
| 1.6 | 1.2 | AA | Very good |
| 1.2 | 0.8 | A | Good |
| 0.8 | 0.4 | BBB | Positive |
| 0.4 | 0 | BB | Normal |
| 0 | -0.4 | B | Satisfactory |
| -0.4 | -0.8 | CCC | Unsatisfactory |
| -0.8 | -1.2 | CC | Adverse |
| -1.2 | -1.6 | C | Bad |
| -1.6 | -2 | D | Critical |