ReadyRatios Software Manual
- Introduction (2)
- Input Tables (7)
- Database and Reports Archive (2)
- Settings (4)
- Statistics (2)
- Tutorial (1)
Settings
- — Analysis Methods Description
- — Formulas Customization
- — Templates Customization
- — Input Tables Customization
Analysis Methods Description
In the section " Analysis methods description " you can get a ready-made company order, which approves the methodology used for financial analysis. The order is generated automatically and describes the formulas used to calculate the financial indicators and their qualitative evaluation included in the program (see "Settings - Formulas customization").
The Order is an internal administrative document that regulates the process of financial analysis in a company. It is recommended to use it, especially in organizations where decisions are based on the analysis of the financial situation of clients (banks, leasing companies, etc.).
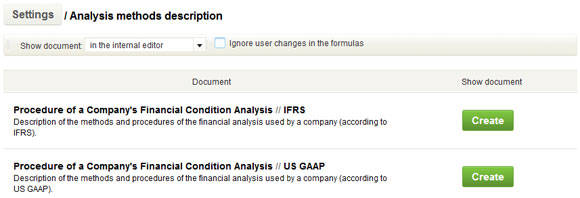
The creation of the Order depends on the choice of the option to ignore or not to ignore the user changes in the preset formulas and qualitative assessments of the indicators. If you check the "Ignore user changes in formulas" option, the order will identify those formulas and qualitative assessments that were originally included in the software by the developers, even if they were later modified by the user.
UpFormulas Customization
One of the main features of ReadyRatios is the possibility for users to customize the formulas used to calculate the indicators. To do this, go to "Settings - Formulas customization". You will see a table with a list of formulas used in the program:
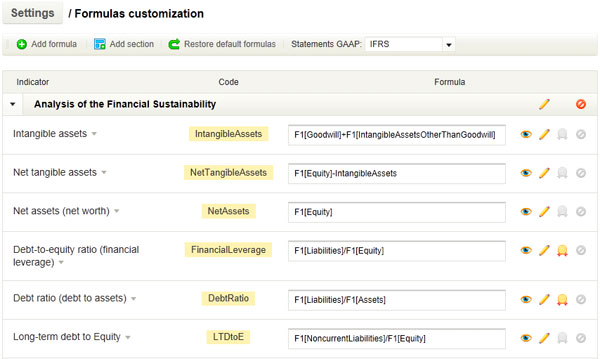
In each row, to the right of the formula, there are three buttons: edit formula, delete formula, setting for qualitative evaluation indicator.
Edit formulas
You must be a registered user to use this function.
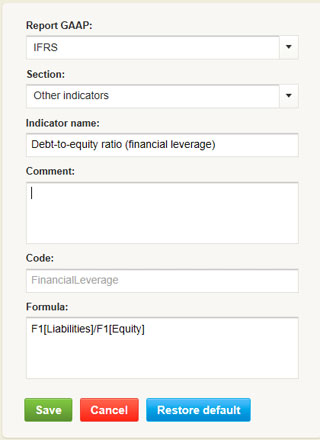
Each formula has the following properties:
- Report GAAP;
- Section;
- Indicator name;
- Comment;
- Code - name of variable which is used to display the values of the report indicator (should consist of Latin letters without spaces);
- The formula - the formula which is used to calculate the indicator.
To write formulas you should use the following syntax:
| Variable | Description |
| F1[ххх] | data in line ххх of form №1 "Statement of financial position" |
|
F1[b][ххх] F1[e][ххх] |
data in line ххх of form №1 "Statement of financial position" at the beginning and end of the period, respectively |
| F2[ххх] | data in line ххх of form №2 "Statement of comprehensive income", recalculated for the given period * |
| F2c[ххх] | data in line ххх of form №2 "Statement of comprehensive income" in the column "for the same period from last year," recalculated for the given period * |
| F1_u[sss] | data in line with sss code from the table "Additional data - table 1" |
|
F1_u[b][ххх] F1_u[e][ххх] |
data in the line with the sss code from the table "Additional data - table 1" at the beginning and end of the period, respectively |
| F2_u[sss] | data in the line with the sss code from the table "Additional data - table 2", recalculated for the given period * |
| F2c_u[ххх] | data in line ххх of form №2 "Statement of comprehensive income" in the column "for the same period from last year," recalculated for the given period * |
|
F1_summa[ххх] F2_summa[ххх] F2c_summa[ххх] |
summarized data for the entire analyzed period in the line with the number xxx of forms №1, form №2 and form №2 "for the same period from last year", respectively |
|
F1_u_summa[sss] F2_u_summa[sss] F2c_u_summa[sss] |
summarized data for the entire analyzed period in the line with the code sss of tables "Additional data - table 1", "Additional data - table 2" and "Additional data - table 2" column "for the same period from last year", respectively |
| СF2[ххх] | data in line ххх of form №2 "Statement of comprehensive income", as entered by the user (i.e. as a progressive total) |
| СF2_u[sss] | data in the line with the sss code from the table "Additional data - table 2" as entered by the user (i.e. as a progressive total) |
| NUM_DAYS | number of days in the period for which we calculate the indicator |
| NUM_MONTH | number of months in the period for which we calculate the indicator |
| abs(х) | module of number x |
* In Form 2, the data is presented as a progressive total, i.e. sales for the 1st quarter, 1st half year, 9 months, per year. In this case, for further calculations, the number F2 is recalculated so that it is possible to go from the progressive period to the data for each interval of the analysis (i.e. revenues for the 1st, 2nd, 3rd and 4th quarters).
In addition, the variables themselves can be used in the formulas below. For example:
EBIT = F2[ProfitLossBeforeTax] + F2[FinanceCosts]
EBITDA = EBIT – F2_u [DepreciationAndAmortisationExpense].
Any formula whose value is used in another formula must be higher in the list. For this reason, there is an option to easily change the order of formulas in the list - just click and hold the left mouse button on the line and move the line up or down. You can edit formulas, add new ones, move and delete them. However, you cannot delete or change the code for any of the formulas that were originally present in the software.
After changing the formulas, their original values are still stored in the program database. In this way, they can be restored at any time:
-
To restore all formulas at once, use "Restore default formulas" (see "Settings" - "Formulas settings" above).
-
To restore the exact formula, use the "Restore default" button in the formula editing window.
Quality assessment index Setting
The program provides qualitative assessments for some indicators, i.e. ranges of "good" - "bad" values. Depending on the quality assessment, the text of the report is generated, the financial status rating is determined, and all the indicators in the report appear in red or green. The button for setting the quality rating (![]() ) is located to the right of the row of the formula table. If this button is light yellow, it means that the qualitative assessment is not set for this indicator. It is possible to set the qualitative assessment for all industries as a whole or for individual sectors:
) is located to the right of the row of the formula table. If this button is light yellow, it means that the qualitative assessment is not set for this indicator. It is possible to set the qualitative assessment for all industries as a whole or for individual sectors:
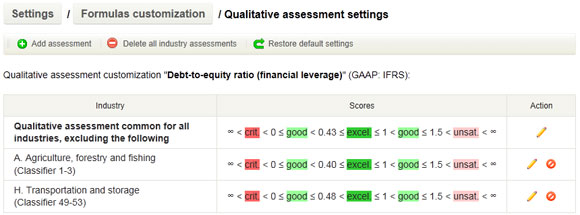
If a certain industry does not have its own settings, the program will use the "Quality assessment common for all industries" setting when analyzing the companies of this industry.
The "Restore default settings" button allows you to restore the qualitative assessment of the indicator to the state originally preset by the author of the program.
UpTemplates Customization
The creation of reports in ReadyRatios is based on templates (see "Input tables" - "Report template"). The standard templates that come with the program can be edited, and you can create your own custom templates based on them.
Templates are in HTML format with some elements of their own markup and are adapted for editing in HTML editors (either built-in or external).
To change the template, go to "Settings" - "Templates customization".
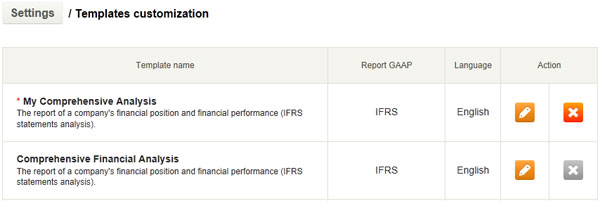
You cannot modify the default templates that come with the program, but you can create custom templates based on them - after editing the default template, it will be saved as a user template.
Simple editing of the template is recommended. For example, you can add a company header to the top of the report or delete the compiler information at the bottom of the report. Apart from that, the editor in the program makes it easy to add custom indicators to the report and the formulas for calculating them, which were mentioned earlier in the " Formulas customization" section.
To make it easier for users to add indicators to the report, the editor has a wizard for creating new tables - see "Insert indicators table" at the top of the editor page. When you click this button, the following dialog appears:
First, determine which table of indicators you want to add to the report. There are three options:
- a table of ratios calculated using only Form #1 "Statement of financial position" data (and / or additional data from Form 1) - such as liquidity ratios, for example;
- a table of ratios calculated using only Form #2 "Statement of comprehensive income" (and / or additional data from Form #2) - for example, gross margin;
- a table of ratios calculated using both Form #1 and Form #2 data - such as asset efficiency indicators, turnover indicators.
This division of indicators into 3 groups is related to the fact that it is not possible to use indicators of different types in one table for the following reasons. Firstly, in the headers, time is specified differently (in the case of indicators in table #1, it is by date (e.g. as for 30.06.2010), and in table #2 by periods of time (March, 1st quarter, 2nd quarter)). Secondly, when calculating for several periods, the number of received indicator values (columns) of different groups differs (by one column).
Depending on this choice, the dialog will display a list of relevant indicators at the bottom of the dialog box.
In this dialog you can also configure the formatting of the date used in the table header, as well as the sign to which the values of the indicators should be rounded. In addition, you can decide whether or not to include columns with the absolute and percentage differences between the first and last indicator of a row in your table, and whether or not to include a comment column (this is usually taken from the "Comment" field of the corresponding indicator - see the "Formulas customization" section).
The indicator values can be displayed in different colors depending on the quality characteristics of a given indicator. And for the changes of the indicator you can choose the colors "green" - "red", depending on whether the indicator has a positive or negative value (or vice versa).
Next, select the indicators you want to see in the table. Rows of indicators can be dragged up and down - this is the order in which they will appear in the final table.
After clicking the "Insert table" button, the ready to use table will appear in the report template.
Custom chart
To insert a custom chart into your template, press the "Insert chart button":
Insert indicator description
You can insert a software generated description of the indicator. The description (up to 3 sentences) is generated by ReadyRatios software depending on the value and changes of the indicator. Press the button "Insert indicator description".
In addition to the description of the value and changes of the indicator, you can add a description of the qualitative assessment (qualitative assessments are defined in the section "Settings - Formulas customization") - just activate the corresponding checkbox.
UpInput Tables Customization
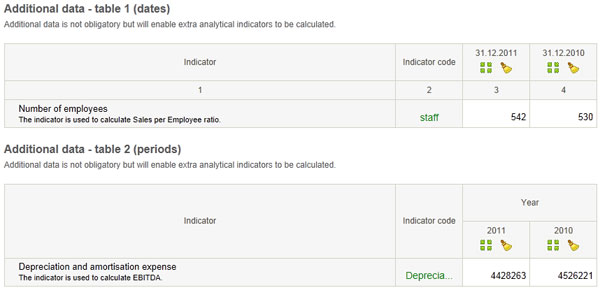
In addition to the two standard forms (#1 "Statement of financial position" and #2 "Statement of comprehensive income"), the program uses the tables "Additional data - Table 1", "Additional data - Table 2" and "Additional data - Constants" when entering the source accounting data. Additional forms 1 and 2 are similar to the two standard forms 1 and 2 in terms of information input, but contain data for deeper analysis.
The "Additional data - constants" form is used for entering additional information used in the report generation, which does not change from period to period. For example, the name of the person who created the report.
Indicators from additional forms can be added and edited, and you can also change their order or remove them. This is done in "Settings" in the " Templates customization" section.
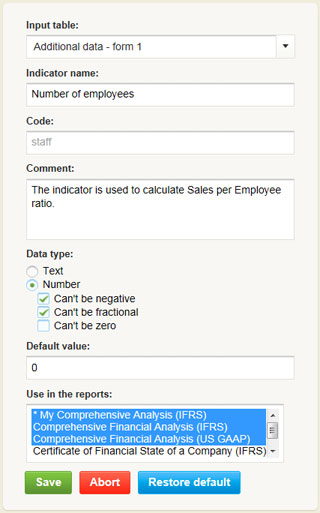
Additional form indicators have the following properties
- Input table - indicates the form to which the input field is applied: "Additional Data - Table 1" (similar to Balance Sheet), "Additional Data - Table 2" (similar to Profit and Loss Statement) or "Additional Data - Constants";
- Name of the indicator displayed in the data entry table;
- Code - the variable name used in formulas for calculations and in the report template to display the indicator values (must contain only Latin letters without spaces);
- Comment - a short explanation of the indicator (optional);
- Data type specification: text or numeric, and whether indicators should be displayed as negative, fractional, or zero;
- Default value;
- A list of reports (templates) for which the entry of a particular indicator is set (i.e. in which reports it is used).
Indicators from additional tables 1 and 2 can be used in formulas in a similar way to using indicators in standard forms. For example, the indicator "Depreciation and amortisation expense", which is provided by additional table 2 under the code "DepreciationAndAmortisationExpense", is used to calculate EBITDA:
EBITDA = EBIT – F2_u [DepreciationAndAmortisationExpense]
Up